Profile Data Block Performance
There are two ways you can examine Data Block performance:
-
Preview Data Block Query: Examine the data block query to see if it can be processed as a single query (most optimal) or requires post-processing by the server.
-
View Data Block Execution Time: Display the actual amount of time a data block query execution required.
Preview Data Block Query
To view the SQL statements that a data block will attempt to execute (the query plan), follow the steps below:
-
Click on the data block to select it.
-
Right-click the data block, and select ‘Show Plan’ from the context menu. Note: You can also access menu options from the ‘More’ button (
 ) in the mini-toolbar.
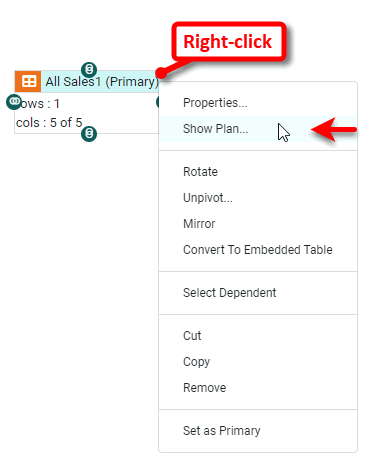
This opens the ‘Query Plan’ panel. The ‘Query Plan’ dialog box displays the queries that will be sent to the database at runtime. Additionally, it shows the data operations that the Data Worksheet will perform in post-processing, after the data is retrieved from the database. The plan also shows the source information for parameterized conditions.
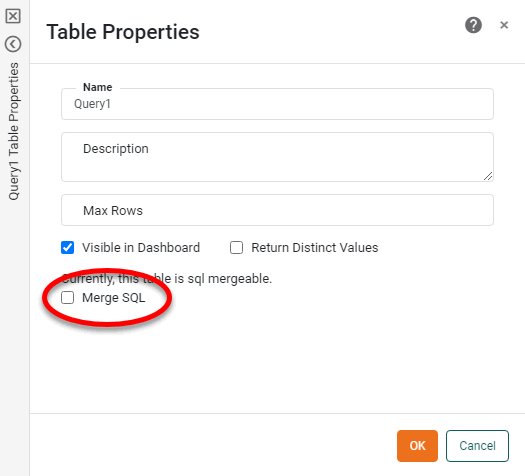
By default, the Data Worksheet attempts to create a single SQL query that fully generates the table’s data. This is typically the most efficient approach because it allows the database to perform all the needed data operations (joins, filtering, etc.). However, you can override this behavior for a particular table by deselecting the ‘Merge SQL’ option in the ‘Table Properties’ dialog box, and in some cases this may improve performance. See Data Block Properties for more information.
This example illustrates how you can control the SQL query that a table sends to the database.
-
Expand the node of the Orders data source.
You may need to download the examples.zip file from GitHub into your environment. (This requires access to Enterprise Manager.) See Import and Export Assets for instructions on how to import. -
Drag the PRODUCTS table to an empty location in the right panel.
-
Drag the CATEGORIES table to an empty location in the right panel.
-
Join the two data blocks using an inner join on the
CATEGORY_IDfield in each data block. See Join Data more details.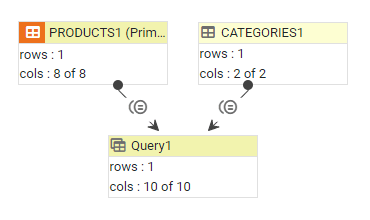
This creates a new table called ‘Query1’.
-
Right-click the ‘Query1’ data block, and select ‘Show Plan’. Note: You can also access menu options from the ‘More’ button (
) in the mini-toolbar. This displays the ‘Query Plan’ dialog box.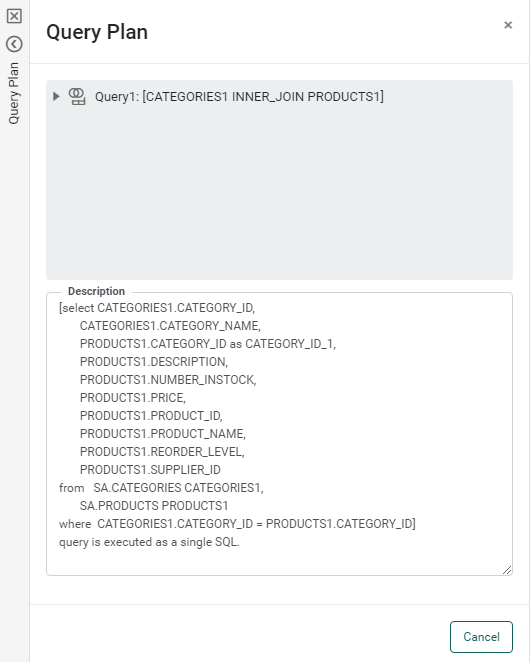
The ‘Query Plan’ dialog box displays the query that the table will send to the database. The statement below the query indicates that this query (including the instructions to join the two tables) will be sent to the database as a single SQL statement, which is also indicated by the single icon in the top panel.
To override the default single-query behavior, follow the steps below:
-
Right-click the ‘Query1’ table again, and select ‘Properties’ from the context menu. This opens the ‘Table Properties’ panel.
-
Deselect ‘Merge SQL’ and press OK to exit the panel.
Right-click the data block, and select ‘Show Plan’ again.
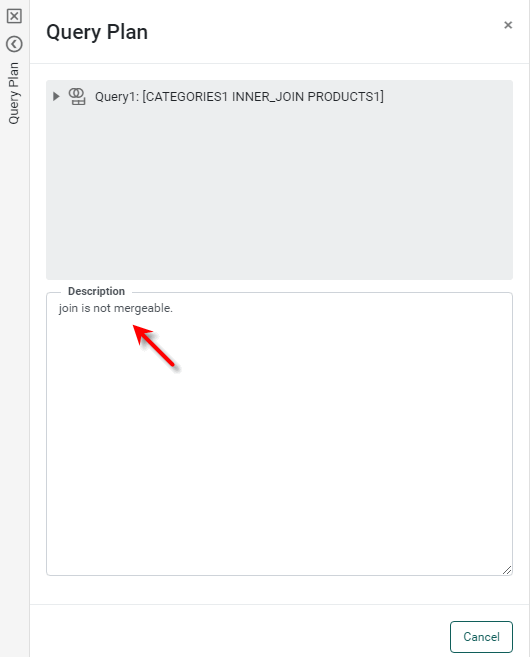
The query plan is again displayed, but the top panel now shows an expandable hierarchy of queries. The PRODUCTS and CATEGORIES queries are each individually executed as single queries, but the inner join that generates the final ‘Query’ table is performed in post-processing.
View Data Block Execution Time
In some cases, you may want to determine which data blocks are most costly in terms of processing. To view execution time for a particular data block, follow the steps below:
-
Click on the data block to select it.
-
In the bottom panel, press the ‘Change View’ button
 , and select ‘Live Data View’
  . This displays a limited preview of the data in the data block.
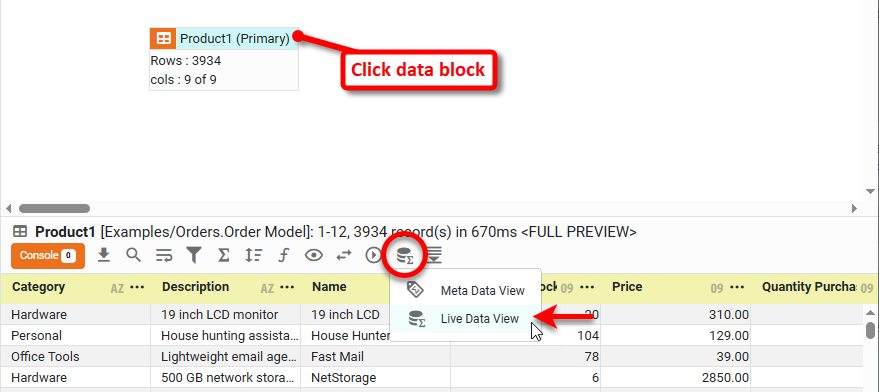
-
Press the ‘Change Data Mode’ button
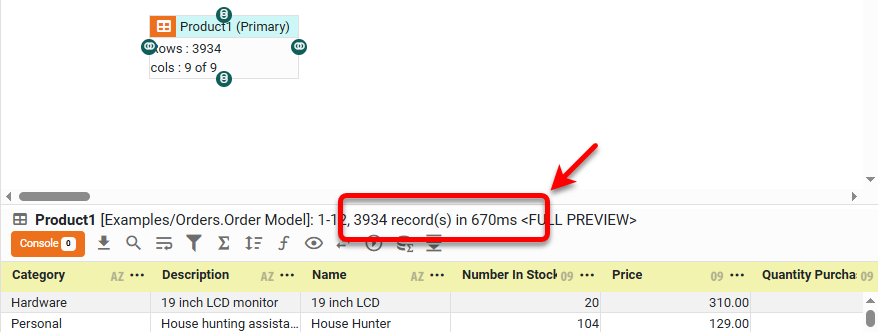
 and deselect ‘Enable display row limit’. This will fully execute the data block query, so that you can see the actual execution time.
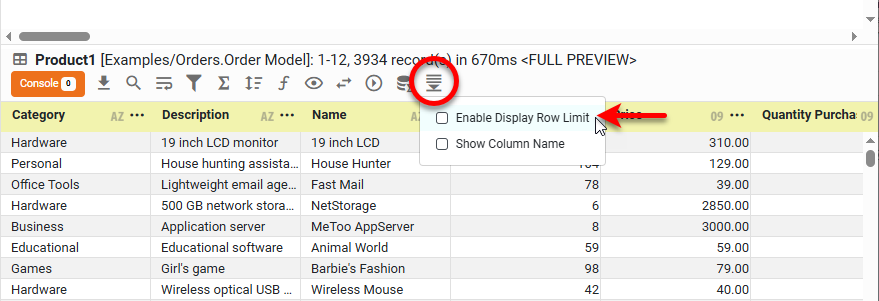
-
Check the status bar for the query execution time for the selected data block.