Create a Custom Map
Watch Video: Create a Custom Map
This video might show an earlier version of the feature or operation that differs in minor ways from the current version.
If you have shapefile data that describes particular geographical regions, you can use this shapefile to create a custom map chart for those regions. The following sections describe the general procedure for converting a shapefile into a map that can be used by the InetSoft server. This process uses the open-source application OpenJUMP, available from the OpenJUMP website.
| For complete information about the features of OpenJUMP, including drawing arbitrary shapes, please consult the OpenJUMP documentation. |
Install OpenJUMP and InetSoft Plugin
The open-source OpenJUMP GIS application allows you to convert data from a shapefile into a map resource that can be used by the StyleBI server. To install the OpenJUMP GIS application and the InetSoft OpenJUMP extension, follow the steps below:
-
Download OpenJUMP GIS version 1.6.3 from the OpenJUMP website. This open-source application allows you to import and edit your shape data.
-
Download the InetSoft OpenJUMP extension (inetsoftMap.zip).
-
Extract the contents of the inetsoftMap.zip file. The archive contains a lib/ext directory with the following JAR files (version numbers may differ).
colt-1.2.0.jar
concurrent-1.3.4.jar
inetsoft.jar
-
Copy these files into the lib/ext directory in the OpenJUMP installation folder.
The OpenJUMP application and InetSoft extension are now ready to use.
Export a Custom Map
To prepare and export a shape file for use with InetSoft, follow the steps below.
-
Install OpenJump and the InetSoft plugin. See Install OpenJUMP and InetSoft Plugin.
-
Copy the shapefile (.shp) and any associated files (.dbf, .shx, etc.) to a location that is accessible to the OpenJUMP application.
-
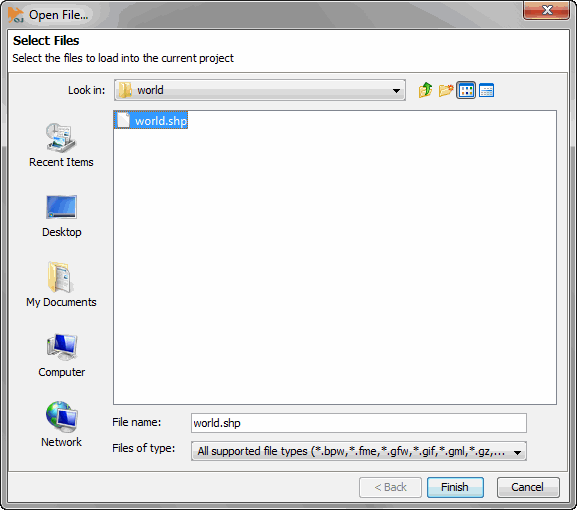
Launch the OpenJUMP application. Select .
-
Select the shapefile that you wish to export, and press Finish. (In this example, world.shp is a shapefile containing the political boundaries of all countries in the world.)
-
Consolidate the logical map features. Consolidation merges all shapes for a atomic entity (e.g., a single country) into a single feature. To do this, follow the steps below:
-
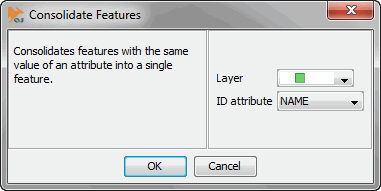
Select . This opens the ‘Consolidate Features’ dialog box.
-
In the ‘Layer’ menu, select the desired geographical layer.
-
In the ‘ID attribute’ menu, select the attribute that uniquely identifies the logical map features. (In this example, this is the country name.)
-
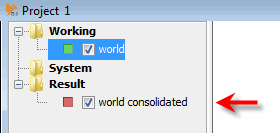
Press OK. This creates the consolidated map, which is listed under the ‘Result’ node in the OpenJUMP project tree.
-
Optional: To conserve memory, delete the original ‘world’ layer from the ‘Working’ node of the OpenJUMP project tree. To do this, right click on the ‘world’ entry, and choose ‘Remove Selected Layers’.
-
-
Optional: If you are creating a map of the United States, select to inset the regions for Alaska and Hawaii. (This yields a transformed view of Alaska and Hawaii commonly used in published U.S. maps.)
-
To reduce the memory required by the map, remove polygons that have areas smaller than a specified size. To do this, follow the steps below:
-
Select . This opens the ‘Area Histogram’ dialog box.
-
Select the desired ‘Layer’, and set the ‘Minimum’, ‘Maximum’, and ‘Interval’ properties of the histogram.
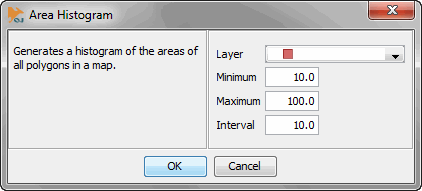
For example, a minimum of 10%, maximum of 100%, and interval of 10% generates histogram values for the following percentages: 10, 20, 30, 40, 50, 60, 70, 80, 90, 100.
-
Press OK to generate the histogram.
-
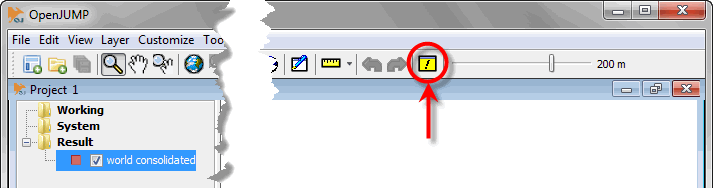
To view the histogram, press the ‘Output Window’ button in the OpenJUMP toolbar.
The histogram indicates the percentage of the polygons in the map which would be removed for a given area threshold. Use the histogram to identify the proper area threshold for removing polygons. For example, the histogram below indicates that by removing all polygons smaller than an area threshold of 0.046081, you could effectively remove 90% of polygons in the map.
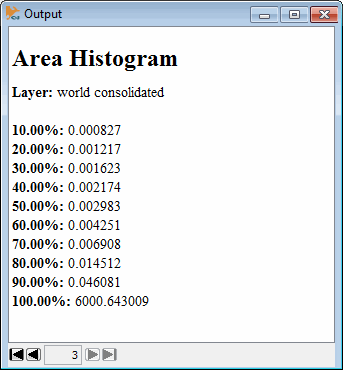
In this example, areas in the range of 0.04 units are probably not visually significant compared to other areas, the largest of which is approximately 6000 units. Therefore, by using a polygon removal threshold of 0.04 you can eliminate the majority of polygons without detectably altering the displayed map.
-
Select . This opens the ‘Remove Small Polygons’ dialog box.
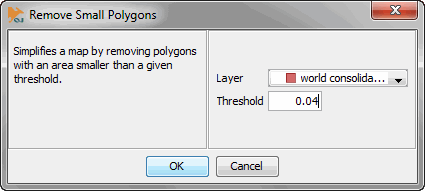
The most significant (largest) polygon of a map feature (e.g., country) is always retained regardless of the threshold. -
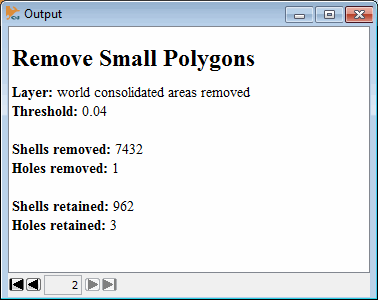
Select the desired ‘Layer’, and enter a ‘Threshold’. Polygons with areas smaller than the threshold will be removed from the map. In this case, a value of 0.04 will result in the removal of approximately 90% of the map’s polygons.
-
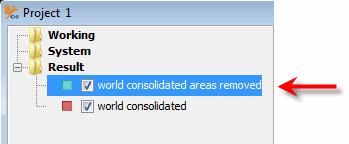
Press OK to initiate the polygon removal. This creates a new map layer (“world consolidated areas removed” in the example).
-
Optional: To remove the original layer (“world consolidated”), right-click the “world consolidated” node, and choose ‘Remove Selected Layers’ from the context menu.
You may need to experiment with different area thresholds to determine which yields the best results. -
To view the report for the polygon removal operation, press the ‘Output Window’ button in the OpenJUMP toolbar.
-
-
To help reduce the memory required for the map, determine the maximum precision to be used. Follow the steps below:
-
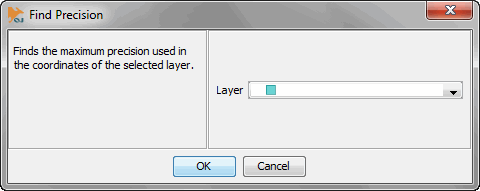
Select . This opens the ‘Find Precision’ dialog box.
-
Select the desired layer, and press OK.
-
Press the ‘Output Window’ button in the OpenJUMP toolbar to view current precision. (The precision is expressed as the number of decimal places used to represent the map coordinates.)
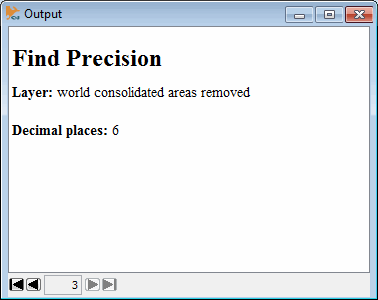
If the precision is unnecessarily high, you can reduce it in the next step. (A precision of six decimal places is more than adequate for most cases.)
-
-
Prepare the map for simplification. Follow the steps below:
-
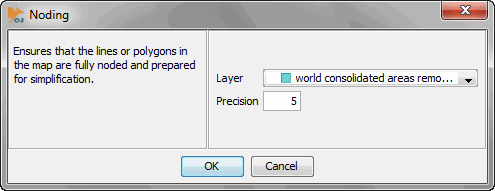
Select . This opens the ‘Noding’ dialog box.
-
Select the desired layer, and enter a value for ‘Precision’. (A precision of six decimal places is more than adequate for most cases.)
-
Press OK. This snaps all coordinates to the specified precision and corrects some common topological errors.
-
Optional: To remove the original layer (“world consolidated areas removed”), right-click the “world consolidated areas removed” node, and choose ‘Remove Selected Layers’ from the context menu.
-
-
Simplify lines and polygon boundaries by removing insignificant points. Follow the steps below:
-
Select . This opens the ‘Point Threshold Histogram’ dialog box.
-
Select the desired ‘Layer’, and set the ‘Minimum’, ‘Maximum’, and ‘Interval’ properties of the threshold histogram.
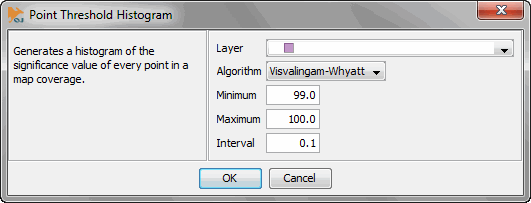
For example, a minimum of 99%, maximum of 100%, and interval of 0.1% generates histogram values for the following percentages: 99.0, 99.1, 99.2, 99.3, 99.4, 99.5, 99.6, 99.7, 99.8, 99.9, 100.
-
Select the desired simplification method in the ‘Algorithm’ menu. In most cases the ‘Visvalingam-Whyatt’ algorithm produces superior results. However, the ‘Douglass-Peucker’ algorithm may be faster.
-
Press OK. This generates a histogram of boundary point significance.
-
To view the histogram, press the ‘Output Window’ button in the OpenJUMP toolbar.
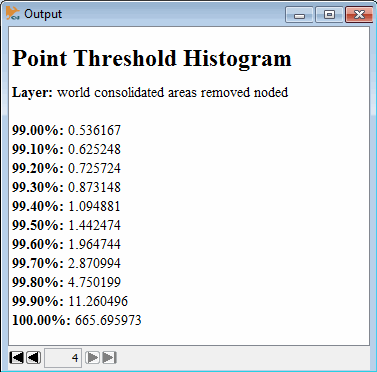
The histogram indicates the percentage of boundary points which would be removed for a given point “significance” threshold. Use the histogram to identify the proper point significance threshold for border simplification. For example, the histogram above indicates that by removing all points with significance smaller than 1.094881, you would effectively remove 99.4% of the boundary points.
In this example, points with significance in the range of 1.0 are probably not visually important compared to other points, the most significant of which have a value of approximately 665. Therefore, by using a point removal threshold of 1.0 you could eliminate the majority of points without detectably altering the displayed map.
-
-
Run the simplification algorithm. Follow the steps below:
-
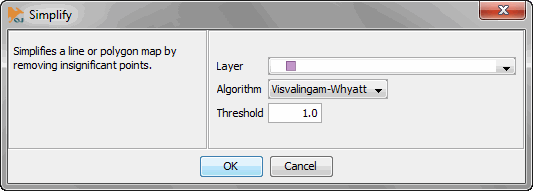
Select . This opens the ‘Simplify’ dialog box.
-
Select the desired ‘Layer’, and choose the same ‘Algorithm’ that you used in the previous step.
-
Enter a ‘Threshold’ value. Boundary points with significance smaller than the threshold will be removed from the map. (In this case, a value of 1.0 will result in the removal of approximately 99% of the map’s points.)
-
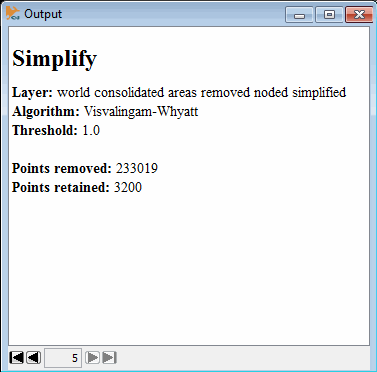
Press OK to start the simplification.
-
Optional: To remove the original layer (“world consolidated areas removed noded”), right-click the “world consolidated areas removed noded” node, and choose ‘Remove Selected Layers’ from the context menu.
You may need to experiment with different point thresholds to determine which yields the best results. -
To view the report for the point removal operation, press the ‘Output Window’ button in the OpenJUMP toolbar.
-
-
Export the map to InetSoft. Follow the steps below:
-
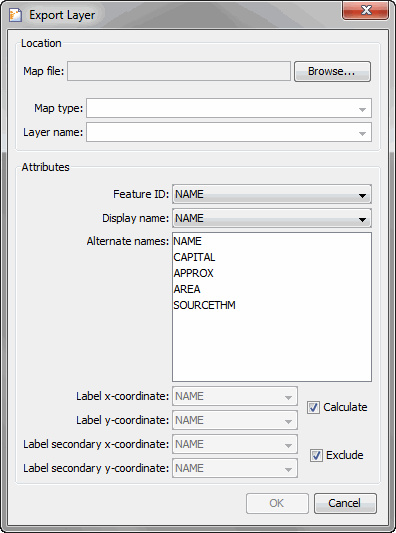
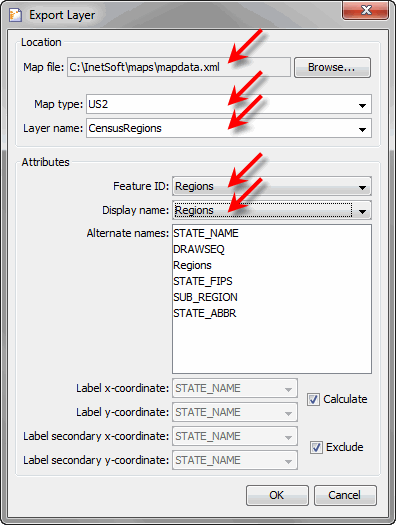
Select the desired layer in the OpenJUMP project tree. Then select . This opens the ‘Export Layer’ dialog box.
-
Specify the ‘Map file’ location. The map file must be named
mapdata.xml. -
Specify the ‘Map type’. This is the top-level category for the map. For example, a map of type “New Jersey” might have layers (specified below) such as “New Jersey Counties” and “New Jersey Zip Codes”.
Do not specify a name for the ‘Map type’ that is identical to one of the built-in map types: ‘U.S.’, ‘Asia’, ‘Canada’, ‘Europe’, ‘Mexico’, or ‘World’. Duplicating a built-in map type name will cause an error. -
Specify the ‘Layer name’. This is the name for the particular map you are exporting. (Select an existing layer to overwrite that layer.)
Do not specify a value for the ‘Layer name’ that is identical to one of the built-in layers: ‘Country’, ‘Province’, ‘State’, ‘City’, or ‘Zip’. Duplicating a built-in layer name will cause an error. The defined map type and any defined layers will appear in the menus of the Chart Editor’s geographical panel when you edit a geographical field in InetSoft.
See Map Chart in Visualize Your Data for more details on using the Chart Editor in a Dashboard.
-
Select the ‘Feature ID’. This is the attribute that uniquely identifies the map features. (In some cases this may be the FIPS or ISO code for a feature.)
-
Select the ‘Display name’. This is the attribute that contains the default, human-readable, names of the map features. (This may be the same as the Feature ID.)
-
Optional: Select any desired ‘Alternate names’. These are attributes that contain alternate display names for the map features. (These might be state abbreviations, ISO codes, etc.)
-
Enable the ‘Calculate’ option to automatically calculate the label coordinates as the centroids of the feature geometry. (If you do this, skip the following two steps). If you wish instead to use attribute values to control label positioning, disable this option.
-
If you have disabled the ‘Calculate’ option, specify for ‘Label x-coordinate’ the attribute that contains the x-coordinates (longitude) for feature label placement.
-
If you have disabled the ‘Calculate’ option, specify for ‘Label y-coordinate’ the attribute that contains the y-coordinates (latitude) for feature label placement.
-
Enable the ‘Exclude’ option if you do not want secondary label coordinates to be included in the exported data. (If you do this, skip the following two steps).
-
If you wish to specify secondary coordinates, disable this option.
Secondary coordinates are not currently used when rendering a chart. -
If you have disabled the ‘Exclude’ option, specify for ‘Label secondary x-coordinate’ the attribute that contains the secondary x-coordinates (longitude) for feature label placement.
-
If you have disabled the ‘Exclude’ option, specify for ‘Label secondary y-coordinate’ the attribute that contains the secondary y-coordinates (latitude) for feature label placement.
-
Press OK to export the map data.
-
-
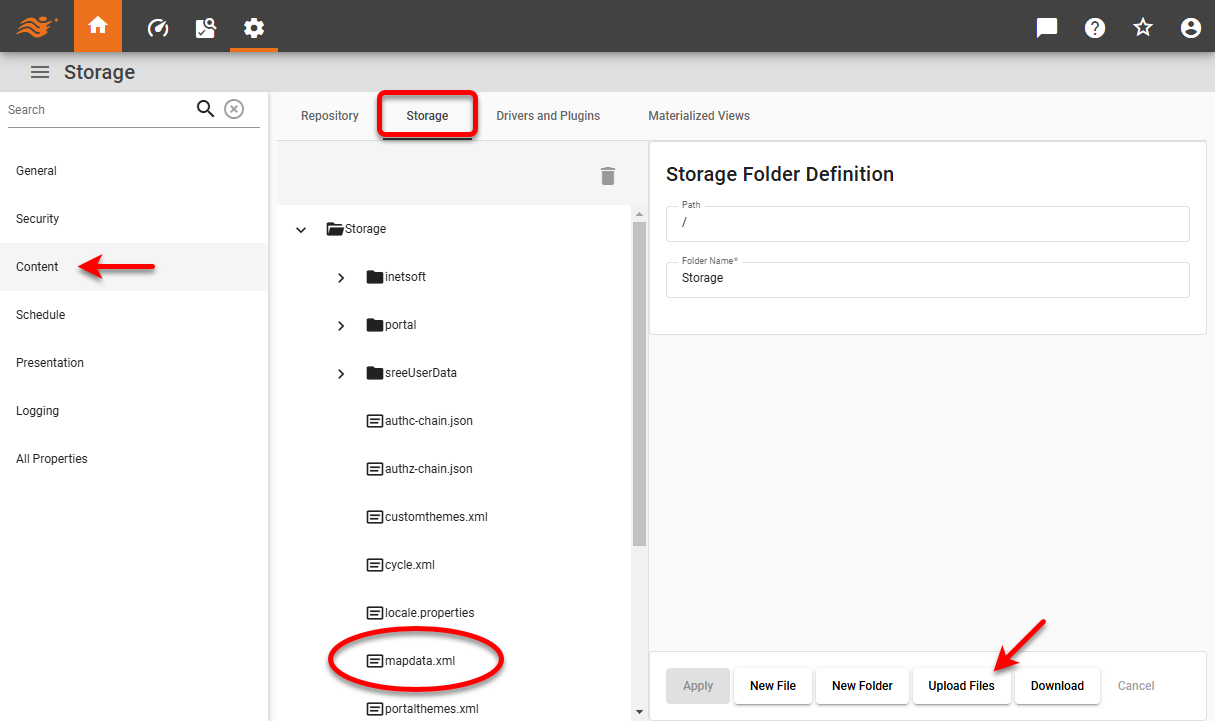
Upload the mapdata.xml file to the root level of server storage. See Storage for information on how to upload a file.
-
Restart the InetSoft server. Your custom map will now be available in the ‘Map’ menu of the Chart Editor, along with the predefined maps.
Add a Layer to Custom Map
There are two ways to add multiple layers to a map. You can create multiple layers based on independent shape files (for example, one layer based on a U.S. county shape file, and another layer based on a U.S. state shape file). You can also use the OpenJUMP software to create arbitrary larger regions composed from the original regions of a single shape file. The following sections explain these approaches.
Add Layer Based on Shape File
To add a layer from a new shapefile to an existing map (for example, to add a “CensusRegions” layer to a “US2” map that already has a “state” layer), follow the steps below:
-
Obtain a shapefile that contains the data for the desired new layer.
-
Proceed through the steps described in Export a Custom Map to process the shapefile appropriately.
-
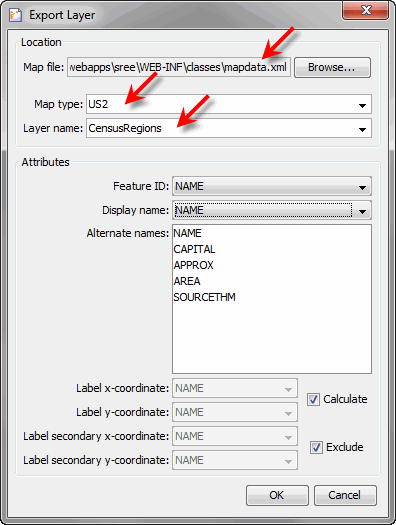
When you select , make the following settings:
-
For the ‘Map file’, select the same mapdata.xml file that already contains the other layer(s) of the map.
-
For the ‘Map type’, use the menu to select the map to which you want to add the layer (e.g., ‘US2’).
-
For the ‘Layer name’, enter the name of the desired new layer (e.g., ‘CensusRegions’).
-
Complete the additional steps described in Export a Custom Map, and press OK.
This exports the new layer into the existing mapdata.xml file, and associates the layer with the existing map.
-
-
Upload mapdata.xml to the root level of server storage. See Storage for information on how to upload a file.
Add Layer by Merging Regions
To add a new layer by merging together regions within an existing shapefile (for example, by merging together states in a “US2” map to form “CensusDivisions”), follow the steps below:
-
Open the shapefile containing the regions that you want to merge in OpenJUMP.
-
Perform any necessary simplification processing as described in Export a Custom Map.
-
Press the ‘View/Edit Attributes’ button in the OpenJUMP toolbar.
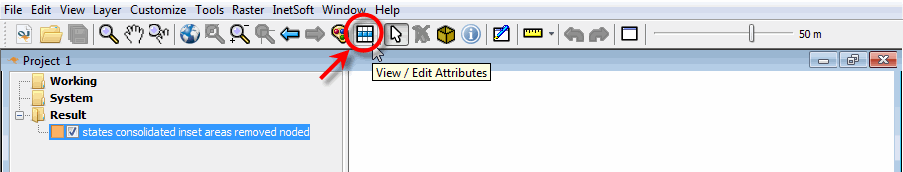
This displays the ‘Attributes’ table for the map.
-
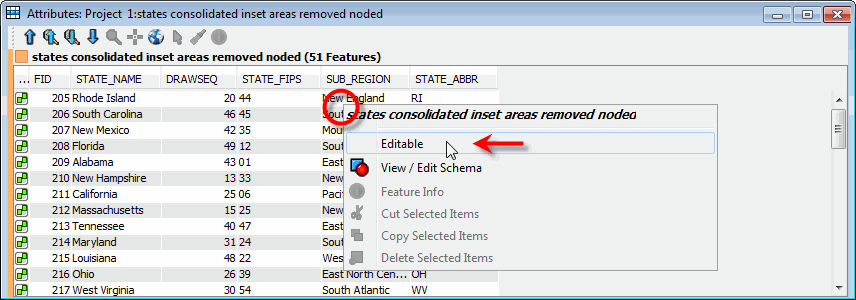
Right-click on the table and select ‘Editable’ from the context menu.
-
Return to the map view. Hold the Shift key and click to select the regions that you want to merge. For example, hold the Shift key and click to select all states belonging to the “Pacific Division” (California, Oregon, Washington, Alaska, Hawaii).
-
Right-click on one of the selected states, and choose ‘Combine Selected Features’.
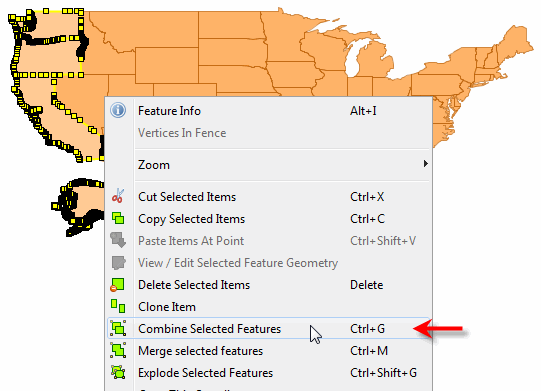
The selected states are now considered a single unit.
-
Repeat the above steps to create any additional desired units. (In this example, we combined states to create the additional census divisions: New England, Middle Atlantic, East North Central, West North Central, South Atlantic, East South Central, West South Central, and Mountain.)
-
Optional: If necessary, create a new column to label the combined features. Follow the steps below:
-
Press the ‘View/Edit Attributes’ button in the OpenJUMP toolbar to display the ‘Attributes’ table.
-
Right-click on the table, and select ‘View/Edit Schema’.
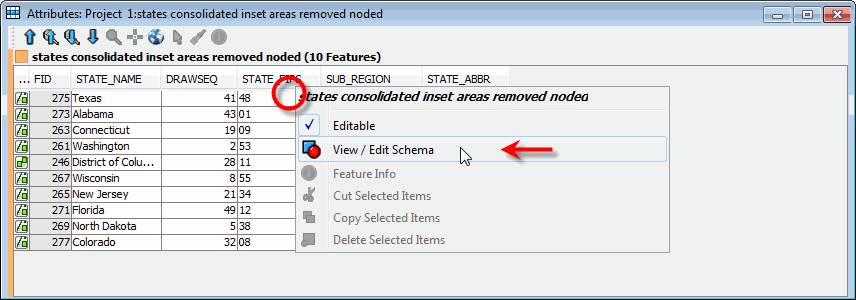
This opens the ‘Edit Schema’ dialog box.
-
Click in the table, and then press the ‘Insert’ (+) button to create a new column.
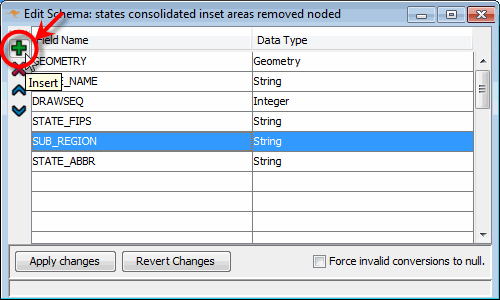
-
Enter the name and type of the new column (e.g., “CensusDivisions”).
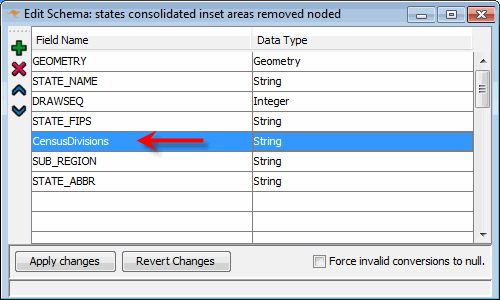
-
Press Apply changes and return to the ‘Attributes’ table. Note that a new column has been added.
-
Enter the appropriate labels into the blank cells.
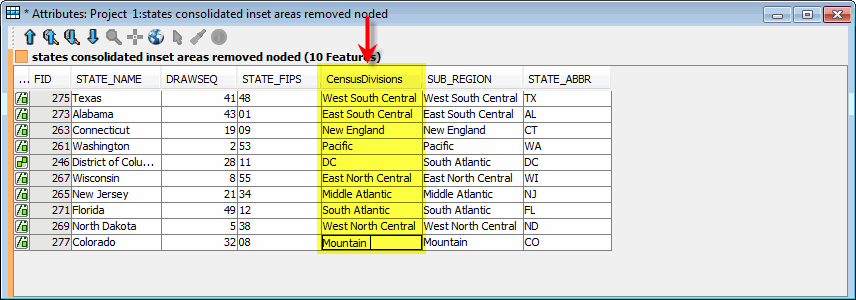
Note that when you click on a blank cell, the corresponding map region is highlighted.
-
-
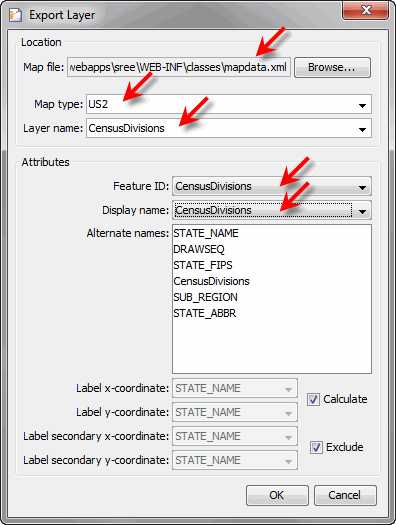
With the new column defined, proceed with the instructions in Export a Custom Map. When you select , make the following settings:
-
For the ‘Map file’, select the same mapdata.xml file that already contains the other layer(s) of the map. (If necessary, first download the mapdata.xml file from the server. See Storage for information on how to download a file.)
-
For the ‘Map type’, use the menu to select the map to which you want to add the layer (e.g., ‘US2’).
-
For the ‘Layer name’, enter the name of the desired new layer (e.g., ‘CensusDivisions’).
-
For the ‘Feature ID’ and ‘Display name’, select the new column that you added to the ‘Attributes’ table.
-
Complete the additional steps described in Export a Custom Map, and press OK.
This exports the new layer into the existing mapdata.xml file, and associates the layer with the existing map.
-
-
Upload the mapdata.xml file to the root level of server storage. See Storage for information on how to upload a file.
Overlay a Shape
In some cases you may want to overlay shapes on top of an existing custom map. For example, you may want to overlay shapes corresponding to the four Census Regions on top of an existing U.S. map that already displays data using a ‘State’ layer. In this case, do not add the Census Regions as a new layer to the existing map as described in Add a Layer to Custom Map, because a given map can only have a single data layer. (You would then be forced to choose either ‘State’ or ‘CensusRegions’ as the displayed layer.)
To create a map that displays data on the ‘State’ layer, but that also draws the Census Regions (without data), follow the steps below:
-
In OpenJUMP, open the shapefile containing the shapes that you want to overlay.
To manually create shapes by merging existing shapes (e.g., to create larger regions by merging multiple states) follow the steps described in Add a Layer to Custom Map, but use the ‘Merge selected features’ option rather than ‘Combine selected features’. Do not export the resulting map.
-
Optional: Perform any necessary simplification processing as described in Export a Custom Map.
-
Select , and make the following settings:
-
For the ‘Map file’, press the Browse button. (You may want to create a new “maps” folder into which to save the export.)
-
For the ‘Map type’, enter a map name (e.g., ‘US2’).
-
For the ‘Layer name’, enter a name for the layer you are exporting (e.g., ‘CensusRegions’).
-
For the ‘Feature ID’ and ‘Display name’, select the appropriate feature column.
-
Press OK. This exports the layer to the location that you specified. The saved files include two CSV files and a mapdata.xml file.
You do not need this new mapdata.xml file. 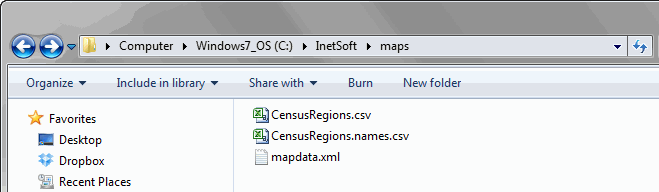
-
-
Stop the InetSoft server if it is running.
-
Open your original mapdata.xml file. (If necessary, first download the original mapdata.xml file from the server. See Storage for information on how to download a file.)
-
Amend mapdata.xml to allow the custom map to access the saved CSV files, and provide the appropriate styles for the labels and outlines. An example follows (see comments).
Example 1. Amended map.xml<?xml version="1.0" encoding="UTF-8" standalone="yes"?> <mapdata> <!-- STYLE BLOCK ADDED BELOW --> <!-- vvvvvvvvvvvvvvvvvvvvvvv --> <style name="label"> <font font="Verdana-BOLD-12" color="#0000FF"/> <line width="3" dash="1"/> <fill color="#0000FF" alpha=".1"/> </style> <nametable name="US_States_names" file="/US_States.names.csv" labels="0"/> <layer name="US_States" id="104" nametable="US_States_names"/> <matching layers="104" columns="0"/> <map type="US2"> <shapedata data="/US_States.csv" layer="US_States"> <!-- SHAPES/LABELS ADDED BELOW --> <!-- vvvvvvvvvvvvvvvvvvvvvvvvv --> <shapes style="label" data="/CensusRegions.csv"/> <labels data="/CensusRegions.names.csv"/> <sampledata>Rhode Island</sampledata> <sampledata>South Carolina</sampledata> </shapedata> </map> </mapdata> -
Upload the mapdata.xml and CSV files to the root level of server storage. See Storage for information on how to upload a file.
-
Restart the InetSoft Server.
-
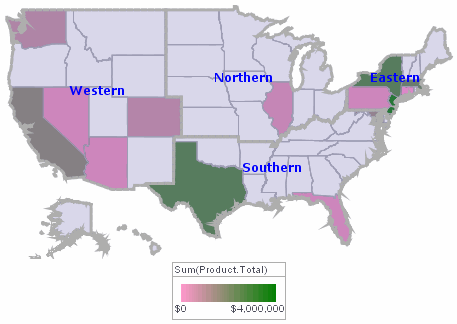
Create a Map Chart based on the custom map. (See Map Chart.) Observe that the specified regions and labels are overlaid on the map as desired.
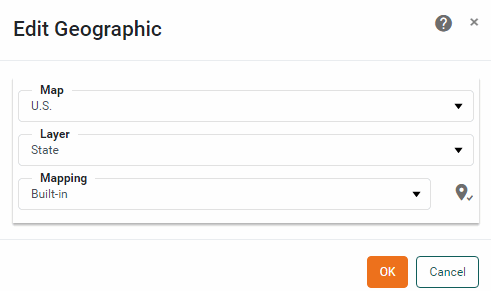
Edit a Custom Map
To edit map data from StyleBI in the OpenJUMP application, follow the steps below:
-
Install the OpenJUMP application and InetSoft extension as described in Install OpenJUMP and InetSoft Plugin.
-
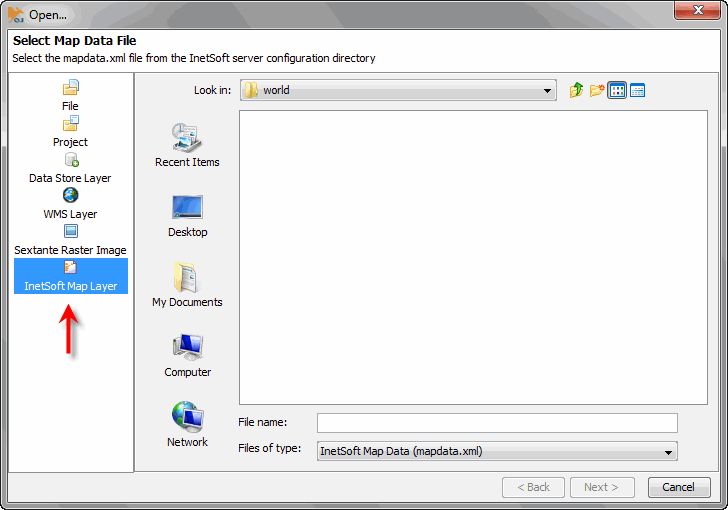
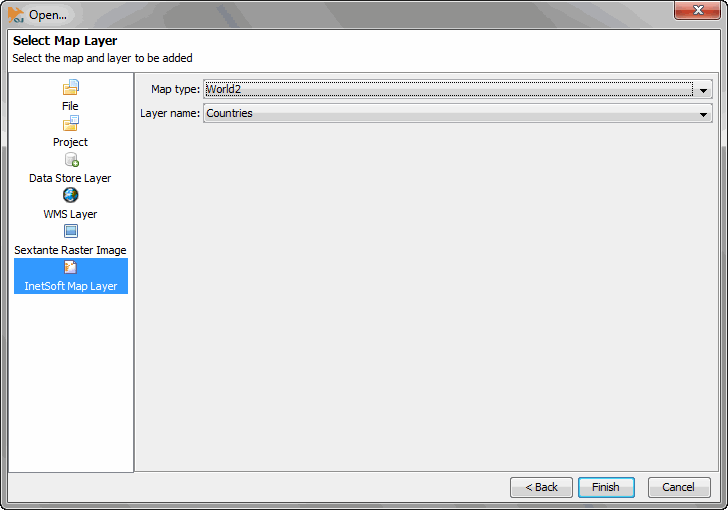
Launch OpenJUMP, and select .
-
Select ‘InetSoft Map Layer’ in the left panel.
-
Locate the mapdata.xml file that you want to edit. Press Next.
-
Select the ‘Map type’ and ‘Layer name’ that you want to edit. (See Export a Custom Map for information about the map type and layer name.)
-
Press Finish. This loads the map data into the OpenJUMP application.
-
Edit the map as desired, and export the modified map. Follow the procedure described in Export a Custom Map.