EGraph.getForm(index)
|
Returns a handle to the GraphForm object specified by the index. This is useful in cases where the form was not explicitly assigned to a variable at creation time. To add a Form, use EGraph.addForm(form).
Example
Chart Component Script
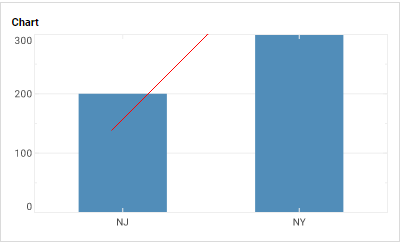
dataset = [["State", "Quantity"], ["NJ", 200], ["NY", 300]]; (1)
graph = new EGraph();
var elem = new IntervalElement("State", "Quantity");
graph.addForm(new LineForm()); (2)
var form = graph.getForm(0); (3)
form.addPoint(java.awt.Point(100,100));
form.addPoint(java.awt.Point(200,200));
form.setColor(java.awt.Color(0xff0000));
graph.addElement(elem);| 1 | See dataset to use a data block instead of an array literal. |
| 2 | Create a LineForm object. |
| 3 | Use getForm() to obtain a handle to the LineForm object.
|
Script that modifies the graph or dataset properties should be placed on the Chart component itself. See Add Component Script for more information. This script has access to the Chart data and Chart API methods. Scripted Charts are not good candidates for user-modification, so you should deselect ‘Enable Ad Hoc Editing’ in the Chart Properties dialog box.
|