LinearScale.setReversed(Boolean)
Specifies the orientation of the scale, either with value increasing from bottom to top (default), or from top to bottom. Note: There is no corresponding “getter” function.
Parameter
- Boolean
-
true: value increases from top to bottom
false: value increases from bottom to top
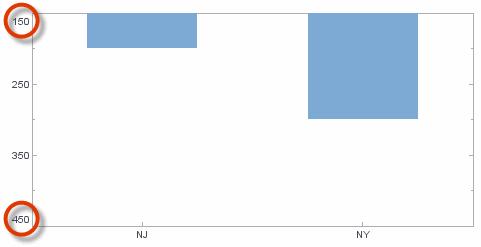
Example
Chart Component Script
dataset = [["State", "Quantity"], ["NJ",200], ["NY",300]]; (1)
graph = new EGraph();
var qscale = new LinearScale("Quantity"); (2)
var elem = new IntervalElement("State", "Quantity");
qscale.setMin(150);
qscale.setMax(450);
// Place setReversed() after setMin() and setMax()
qscale.setReversed(true); (3)
graph.setScale("Quantity", qscale); (4)
graph.addElement(elem);| 1 | See dataset to use a data block instead of an array literal. |
| 2 | Create the LinearScale object. |
| 3 | Use setReversed to set the scale orientation. |
| 4 | Use EGraph.setScale(field, scale) to assign the Scale to the Chart. |
Script that modifies the graph or dataset properties should be placed on the Chart component itself. See Add Component Script for more information. This script has access to the Chart data and Chart API methods. Scripted Charts are not good candidates for user-modification, so you should deselect ‘Enable Ad Hoc Editing’ in the Chart Properties dialog box.
|
|
To change the property on a Chart that was previously created with the Chart Editor, use “getter” methods such as EGraph.getCoordinate() ① and RectCoord.getYScale() ② to obtain a handle to the desired Coordinate and Scale. For example: |