Filter Data
You can filter data at the data pipeline level (Data Worksheet) or presentation level (Dashboard).
-
To filter at the Dashboard level, see Filter a Dashboard. This provides the user with the greatest flexibility to adjust the filtering,
-
To filter at the Data Worksheet level, see the sections below.
When you perform filtering in a Data Worksheet, only the filtered data will be available for further manipulation and presentation (although the filter itself can be parameterized and controlled from a Dashboard; see Filter Using Dynamic Conditions below). Filtering at the Data Worksheet level may be most efficient when you want to use the filtered data set across many Dashboards.
Filter Detail Data
Watch Video: Filter Detail Data
This video might show an earlier version of the feature or operation that differs in minor ways from the current version.
To filter the detail (pre-aggregate) data in a data block, follow the steps below. Note: If you want Dashboard users to dynamically filter the data in a Dashboard, see Filter a Dashboard instead.
| Filtering conditions are applied to data retrieved from database. The number of rows retrieved is set by the ‘Max Rows’ setting. See Data Block Properties for more information. |
-
Create the data block you want to filter. See Create a Data Worksheet for information on how to create a data block.
-
Click on the data block to select it.
-
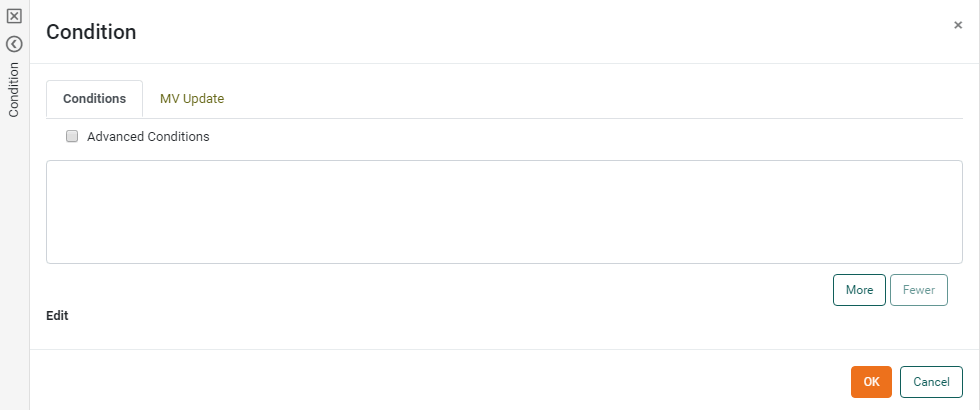
In the bottom panel press the ‘Define Condition’ button
 . This opens the Condition panel.
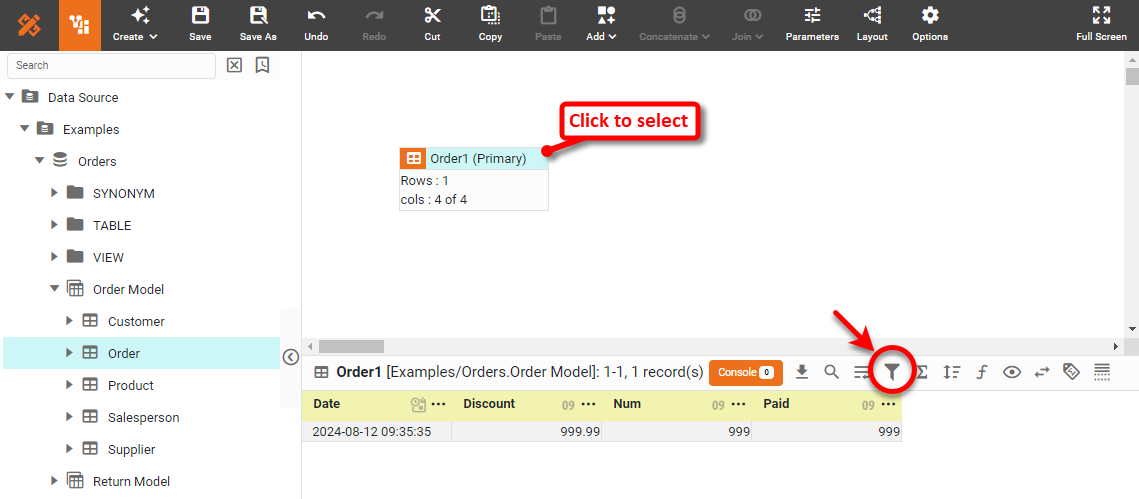
-
Select the ‘Advanced Conditions’ check box.
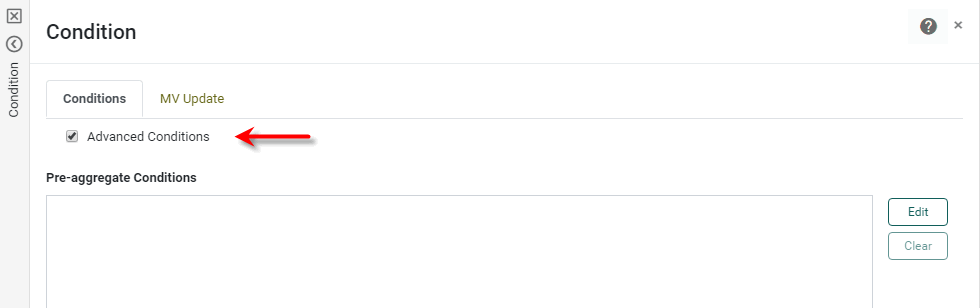
The ‘Advanced Conditions’ check box toggles between simple and advanced conditions. (See Example: Simple Conditions below for an example of using simple conditions.)
If you switch from the advanced conditions interface to the simple conditions interface, any advanced condition features that you have specified (for example, “OR” operators) are permanently lost. -
Press the Edit button next to the ‘Pre-aggregate Conditions’ panel. Use the menus to specify the desired condition.
Read more about filter operators…
- equal to
-
True when the column value identically matches the specified criterion. (String matching is case-insensitive.)
- one of
-
True when the column value is a member of the set of criteria values. (String matching is case-sensitive.)
- less than
-
True when the column value is strictly less than the criterion value. Select the ‘or equal to’ check box to obtain a “less than or equal to” criterion. (Strings are compared based on their alphabetical ordering.)
- greater than
-
True when the column value is strictly greater than the criterion value. Select the ‘or equal to’ check box to obtain a “greater than or equal to” criterion. (Strings are compared based on their alphabetical ordering.)
- between
-
True when the column value is within the interval specified by its upper and lower boundaries. The boundary values are included in the interval. (Strings are compared based on their alphabetical ordering.) For date fields, consider using the ‘in range’ operator in place of specifying fixed dates.
- null
-
True when the column value is ‘null’. (Nulls appear as empty cells in a table.)
- top
-
For grouped and aggregated data, true when the aggregated column value is among the top N aggregated values, according to the grouping specified by the secondary menu.
- bottom
-
For grouped and aggregated data, true when the aggregated column value is among the bottom N aggregated values, according to the grouping specified by the secondary menu.
- starting with
-
For numeric and string data, true when the column value begins with (i.e., the left-most characters match) the specified numerals or characters. String matching is case-insensitive.
- contains
-
For numeric and string data, true when the column value contains the exact sequence of specified numerals or characters. String matching is case-insensitive.
- in range
-
For date fields, true when the column value (date) falls within the specified date range criterion.
The following predefined ranges are available for use with the in range operator. Others may also be provided. See the explanations below the table.
Last year
This January
Last November
This year
This February
Last December
Last quarter
This March
Last week
This quarter
This April
This week
Last quarter last year
This May
Week before last week
This quarter last year
This June
Last 7 days
1st Quarter this year
This July
Last 8-14 days
2nd Quarter this year
This August
Last 4 weeks
3rd Quarter this year
This September
Last 5-8 weeks
4th Quarter this year
This October
Last 30 days
1st Quarter last year
This November
Last 31-60 days
2nd Quarter last year
This December
Today
3rd Quarter last year
Last January
Tomorrow
4th Quarter last year
Last February
Yesterday
1st half of this year
Last March
Year to date
2nd half of this year
Last April
Year to date last year
1st half of last year
Last May
Quarter to date
2nd half of last year
Last June
Quarter to date last year
Last month
Last July
Quarter to date last quarter
This month
Last August
Month to date
Last month last year
Last September
Month to date last year
This month last year
Last October
Month to date last month
The explanation of the last five ranges is as follows:
- Year to date last year
-
The same date range provided by the ‘Year to date’ option (i.e., beginning of year to present date), but offset to the previous year. For example, if today is Nov. 8, 2011, the range selected by ‘Year to date last year’ is Jan. 1, 2010–Nov. 8, 2010.
- Month to date last month
-
The same date range provided by the ‘Month to date’ option (i.e., beginning of month to present date), but offset to the previous month. For example, if today is Nov. 8, 2011, the range selected by ‘Month to date last month’ is Oct. 1, 2011–Oct. 8, 2011.
- Quarter to date last quarter
-
The same date range provided by the ‘Quarter to date’ option (i.e., beginning of quarter to present date), but offset to the previous quarter. For example, if today is Nov. 8, 2011, the range selected by ‘Quarter to date last quarter’ is July. 1, 2011–Aug. 8, 2011.
- Month to date last year
-
The same date range provided by the ‘Month to date’ option (i.e., beginning of month to present date), but offset to the previous year. For example, if today is Nov. 8, 2011, the range selected by ‘Month to date last year’ is Nov. 1, 2010–Nov. 8, 2010.
- Quarter to date last year
-
The same date range provided by the ‘Quarter to date’ option (i.e., beginning of quarter to present date), but offset to the previous year. For example, if today is Nov. 8, 2011, the range selected by ‘Quarter to date last quarter’ is Oct. 1, 2010–Nov. 8, 2010.
If the condition you specify references data model attributes that do not already exist in the data block, these attributes are automatically added to the data block as hidden columns.
-
Press Append to add the condition.
-
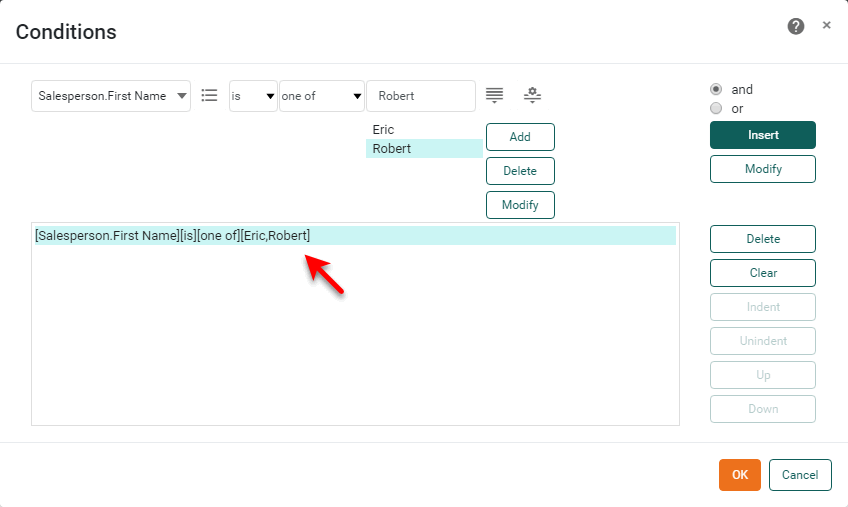
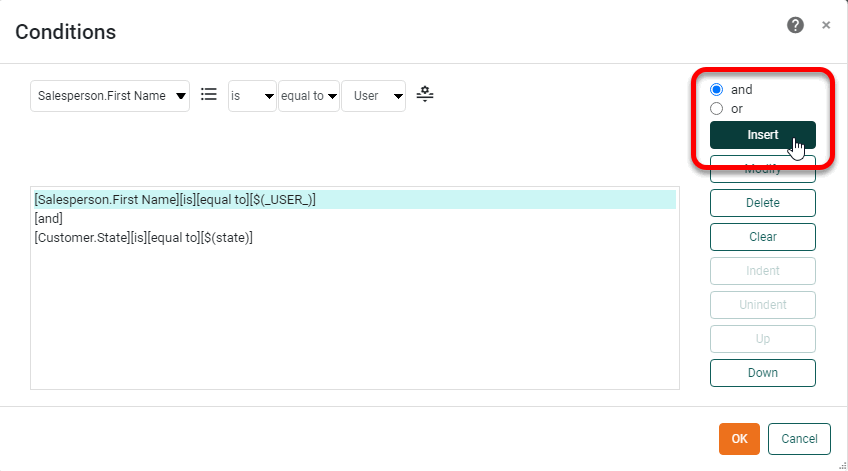
Optional: To create a compound condition, repeat the above steps to specify another condition clause, select ‘and’ or ‘or’, and press Insert. This adds the additional clause into the composite condition.
-
Optional: Repeat the above steps to add additional clauses into the condition.
-
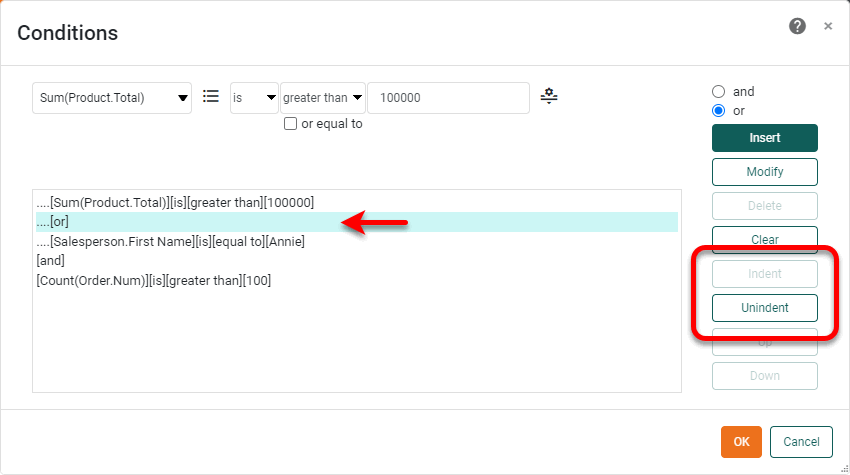
Optional: To specify the order of evaluation for a compound condition, use the Indent and Unindent buttons. To indent a set of clauses, select the ‘and’ or ‘or’ operator the condition box, and then press Indent. Use Unindent to reverse indentation.
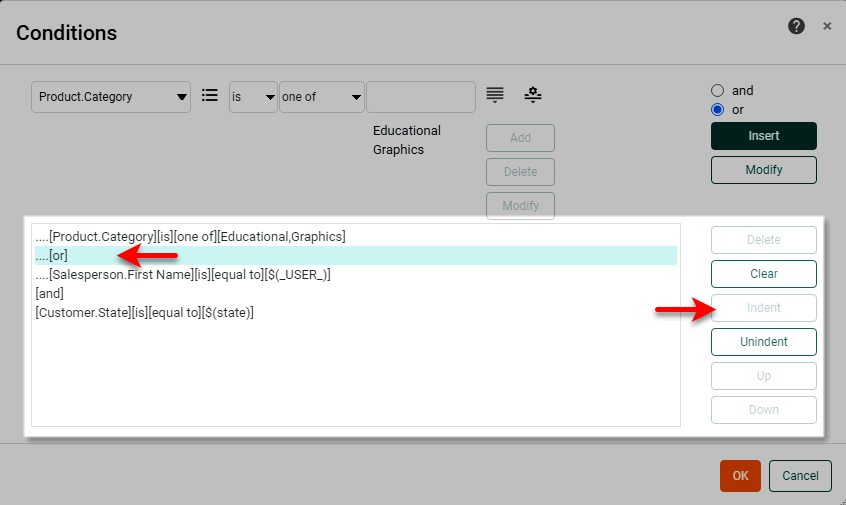
Clauses are evaluated in order of indentation, the most indented clauses being evaluated first.
-
To delete a clause in the condition, select the clause and press Delete. To delete ALL clauses in the condition, press Clear. To reposition a clause in the condition, select the clause and press Up or Down.
-
To modify a clause in the condition, select the clause and then specify the clause using the menus at the top (as described above). Press Modify to change the existing condition to a new condition matching the menu selections.
-
Press OK to close the dialog box. The selected data set is now filtered to return only data matching the specified condition.
-
Optional: To view the filtered data, enable ‘Live Data View’. (See Preview Data.)
-
Save the Data Worksheet by pressing the ‘Save’ button
 in the toolbar, or press Ctrl+S on the keyboard.
You can now use this Data Worksheet as the data source for a Dashboard. See Visualize Your Data to create a Dashboard.
If your condition requires only the “AND” operator and does not require the “OR” operator, or if it requires no logical operators at all, you can use the simple condition interface (without selecting the ‘Advanced Conditions’ check box). See the example below.
In the sample ‘Sales Explore’ Data Worksheet, retrieve only orders with sales of at least $1,000.
-
Create a new Data Worksheet. For information on how to create a new Data Worksheet, see Create a Data Worksheet.
The 'Sales Explore' Data Worksheet can be found in . You may need to download the examples.zip file from GitHub into your environment. (This requires access to Enterprise Manager.) See Import and Export Assets for instructions on how to import. -
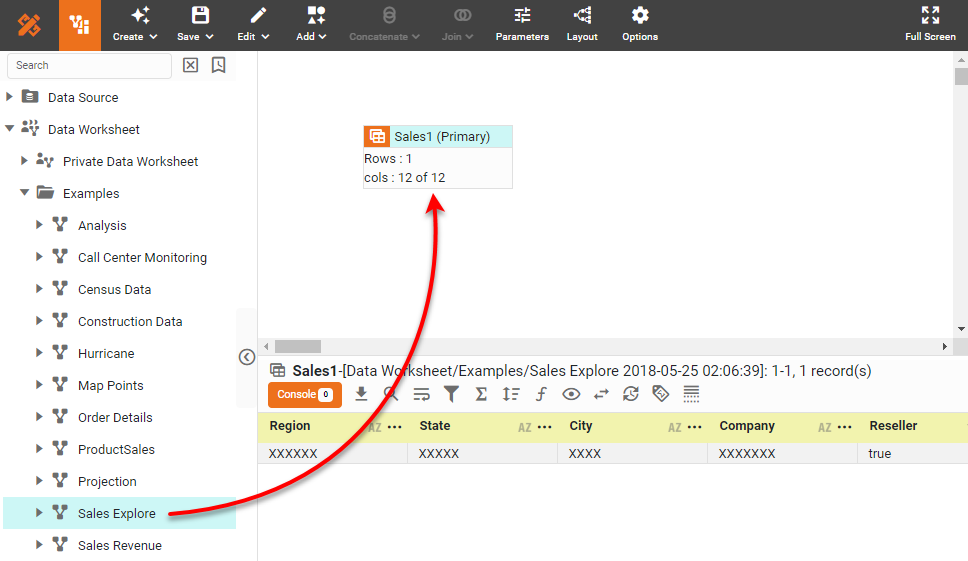
From the left panel, drag the ‘Sales Explore’ Data Worksheet onto an empty area in the right panel. This creates the data block ‘Sales1’.
-
Click the data block to select it.
-
Press the ‘Define Condition’ button
in the bottom panel. This opens the ‘Conditions’ panel.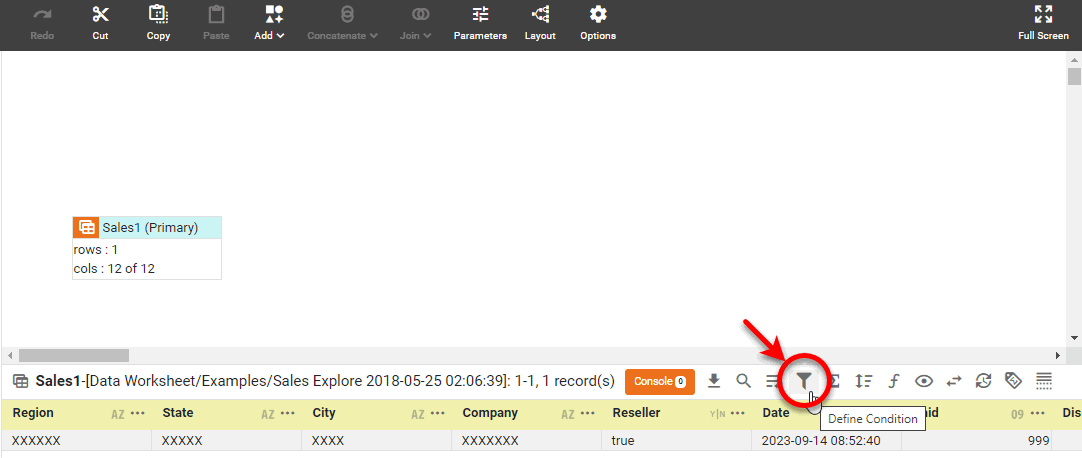
-
Press the More button to create a new condition.
-
Enter the following condition:
[Total] [is] [greater than] [1000].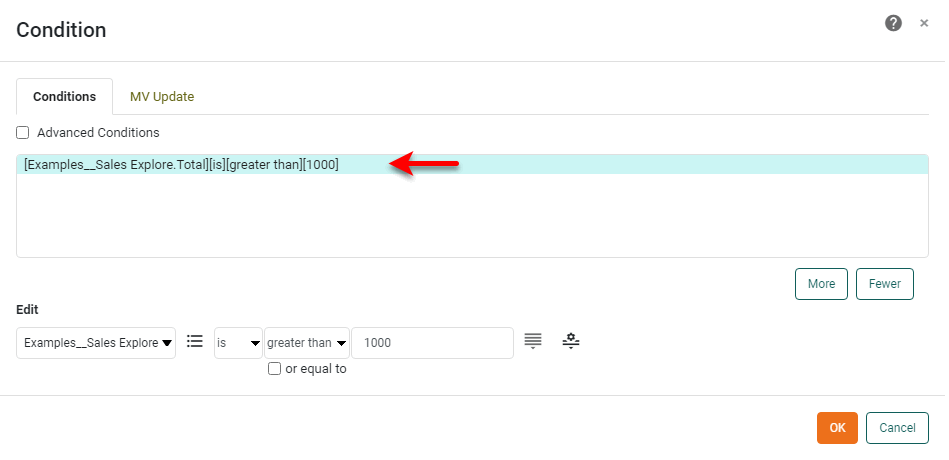
-
Optional: To delete a condition, select the condition in the list and press the Fewer button. Press OK.
-
Preview the data. (Click to select the data block, press the ‘Change View’ button
 in the bottom panel, and select ‘Live Data View’
  .)
.)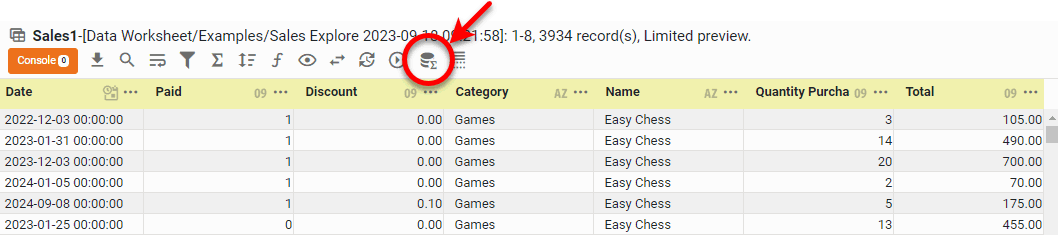
Note that only totals greater than $1000 are returned.
Filter Aggregated Data
Watch Video: Filter Aggregate Data
This video might show an earlier version of the feature or operation that differs in minor ways from the current version.
To filter data that has been grouped and aggregated in a data block, follow the steps below.
| If you want Dashboard users to dynamically filter data in a Dashboard, see Filter a Dashboard in instead. |
-
Create the data block you want to filter. See Create a Data Worksheet for information on how to create a data block.
-
Apply the desired grouping and aggregation to the data block. (See Group and Aggregate Data for more details.)
-
Click on the data block to select it. In the bottom panel press the ‘Define Condition’ button
. This opens the Condition panel.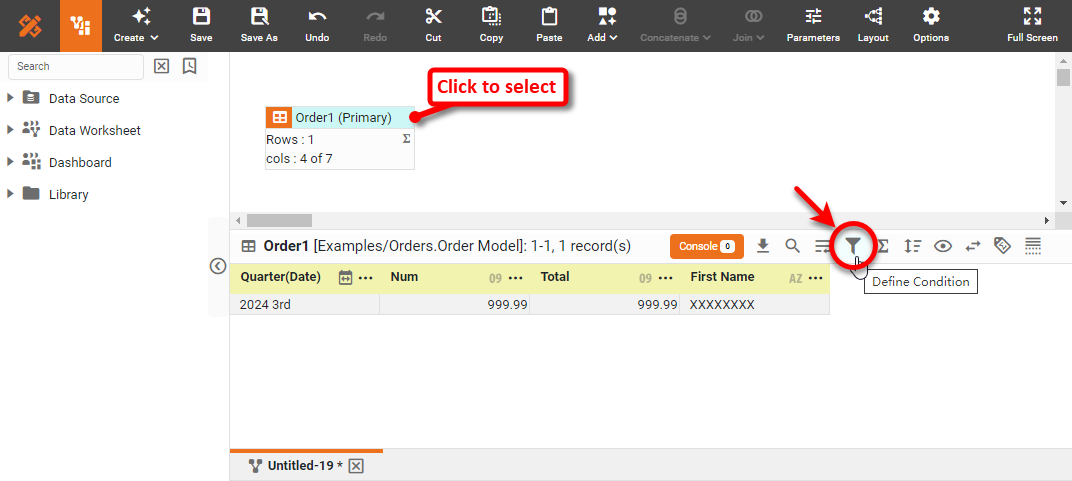
-
Select the ‘Advanced Conditions’ check box.
The ‘Advanced Conditions’ check box toggles between simple and advanced conditions. Post-aggregate filtering can only be specified with ‘Advanced Conditions’ enabled.
If you switch from the advanced conditions interface to the simple conditions interface, any advanced condition features that you have specified (for example, post-aggregate conditions) are permanently lost. -
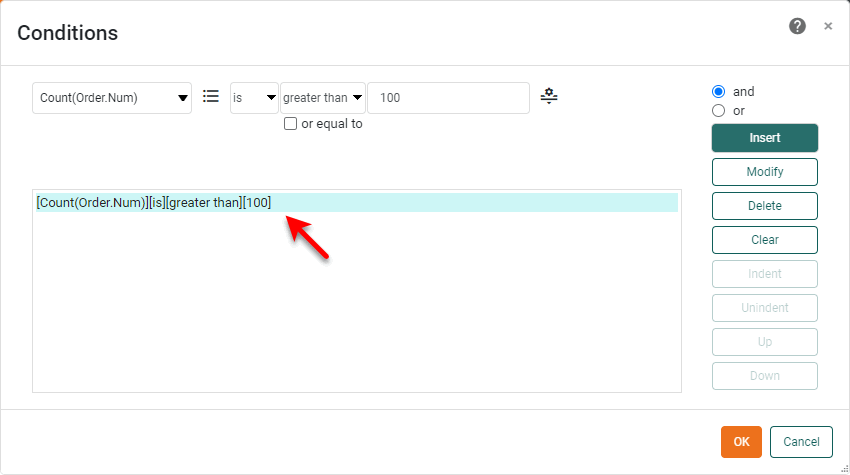
Press the Edit button next to the ‘Post-aggregate Conditions’ panel. Use the menus to specify the desired condition.
Expand to see available filter operators…
- equal to
-
True when the column value identically matches the specified criterion. (String matching is case-insensitive.)
- one of
-
True when the column value is a member of the set of criteria values. (String matching is case-sensitive.)
- less than
-
True when the column value is strictly less than the criterion value. Select the ‘or equal to’ check box to obtain a “less than or equal to” criterion. (Strings are compared based on their alphabetical ordering.)
- greater than
-
True when the column value is strictly greater than the criterion value. Select the ‘or equal to’ check box to obtain a “greater than or equal to” criterion. (Strings are compared based on their alphabetical ordering.)
- between
-
True when the column value is within the interval specified by its upper and lower boundaries. The boundary values are included in the interval. (Strings are compared based on their alphabetical ordering.) For date fields, consider using the ‘in range’ operator in place of specifying fixed dates.
- null
-
True when the column value is ‘null’. (Nulls appear as empty cells in a table.)
- top
-
For grouped and aggregated data, true when the aggregated column value is among the top N aggregated values, according to the grouping specified by the secondary menu.
- bottom
-
For grouped and aggregated data, true when the aggregated column value is among the bottom N aggregated values, according to the grouping specified by the secondary menu.
- starting with
-
For numeric and string data, true when the column value begins with (i.e., the left-most characters match) the specified numerals or characters. String matching is case-insensitive.
- contains
-
For numeric and string data, true when the column value contains the exact sequence of specified numerals or characters. String matching is case-insensitive.
- in range
-
For date fields, true when the column value (date) falls within the specified date range criterion.
The following predefined ranges are available for use with the in range operator. Others may also be provided. See the explanations below the table.
Last year
This January
Last November
This year
This February
Last December
Last quarter
This March
Last week
This quarter
This April
This week
Last quarter last year
This May
Week before last week
This quarter last year
This June
Last 7 days
1st Quarter this year
This July
Last 8-14 days
2nd Quarter this year
This August
Last 4 weeks
3rd Quarter this year
This September
Last 5-8 weeks
4th Quarter this year
This October
Last 30 days
1st Quarter last year
This November
Last 31-60 days
2nd Quarter last year
This December
Today
3rd Quarter last year
Last January
Tomorrow
4th Quarter last year
Last February
Yesterday
1st half of this year
Last March
Year to date
2nd half of this year
Last April
Year to date last year
1st half of last year
Last May
Quarter to date
2nd half of last year
Last June
Quarter to date last year
Last month
Last July
Quarter to date last quarter
This month
Last August
Month to date
Last month last year
Last September
Month to date last year
This month last year
Last October
Month to date last month
The explanation of the last five ranges is as follows:
- Year to date last year
-
The same date range provided by the ‘Year to date’ option (i.e., beginning of year to present date), but offset to the previous year. For example, if today is Nov. 8, 2011, the range selected by ‘Year to date last year’ is Jan. 1, 2010–Nov. 8, 2010.
- Month to date last month
-
The same date range provided by the ‘Month to date’ option (i.e., beginning of month to present date), but offset to the previous month. For example, if today is Nov. 8, 2011, the range selected by ‘Month to date last month’ is Oct. 1, 2011–Oct. 8, 2011.
- Quarter to date last quarter
-
The same date range provided by the ‘Quarter to date’ option (i.e., beginning of quarter to present date), but offset to the previous quarter. For example, if today is Nov. 8, 2011, the range selected by ‘Quarter to date last quarter’ is July. 1, 2011–Aug. 8, 2011.
- Month to date last year
-
The same date range provided by the ‘Month to date’ option (i.e., beginning of month to present date), but offset to the previous year. For example, if today is Nov. 8, 2011, the range selected by ‘Month to date last year’ is Nov. 1, 2010–Nov. 8, 2010.
- Quarter to date last year
-
The same date range provided by the ‘Quarter to date’ option (i.e., beginning of quarter to present date), but offset to the previous year. For example, if today is Nov. 8, 2011, the range selected by ‘Quarter to date last quarter’ is Oct. 1, 2010–Nov. 8, 2010.
-
Press Append to add the condition.
-
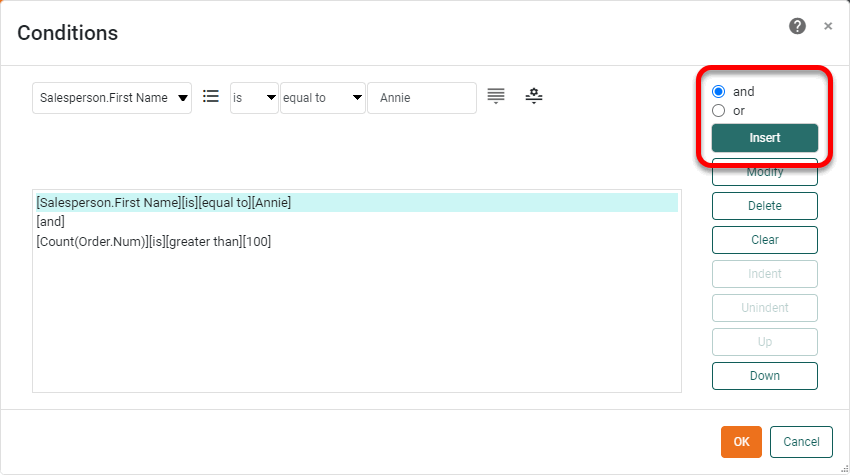
Optional: To create a compound condition, repeat the above steps to specify another condition clause, select ‘and’ or ‘or’, and press Insert. This adds the additional clause into the composite condition. See below.
-
Optional: Repeat the above steps to add additional clauses into the condition.
-
Optional: To specify the order of evaluation for a compound condition, use the Indent and Unindent buttons. To indent a set of clauses, select the ‘and’ or ‘or’ operator the condition box, and then press Indent. Use Unindent to reverse indentation.
Clauses are evaluated in order of indentation, the most indented clauses being evaluated first.
-
To delete a clause in the condition, select the clause and press Delete. To delete ALL clauses in the condition, press Clear. To reposition a clause in the condition, select the clause and press Up or Down.
-
To modify a clause in the condition, select the clause and then specify the clause using the menus at the top (as described above). Press Modify to change the existing condition to a new condition matching the menu selections.
-
Press OK to close the dialog box. The selected data set is now filtered to return only data matching the specified condition.
-
Optional: To view the filtered data, enable ‘Live Data View’. (See Preview Data.)
-
Save the Data Worksheet by pressing the ‘Save’ button
in the toolbar, or press Ctrl+S on the keyboard.
You can now use this Data Worksheet as the data source for a Dashboard. See Visualize Your Data to create a Dashboard.
Filter Top and Bottom Data
Watch Video: Filter Top or Bottom Data
This video might show an earlier version of the feature or operation that differs in minor ways from the current version.
A condition that filters the top-N or bottom-N records or groups based on a specified measure is called a ranking condition.
| If you want to configure ranking in a specific Chart or Crosstab, see Filter a Dashboard instead. |
To create a ranking condition on a data block, follow the steps below:
-
Create the data block you want to filter. See Create a Data Worksheet for information on how to create a data block.
-
Apply the desired grouping and aggregation to the data block. (See Group and Aggregate Data for more details.)
-
Click on the data block to select it.
-
In the bottom panel press the ‘Define Condition’ button
. This opens the Condition panel. -
Select the ‘Advanced Conditions’ check box.
The ‘Advanced Conditions’ check box toggles between simple and advanced conditions. Ranking filters can only be specified with ‘Advanced Conditions’ enabled.
If you switch from the advanced conditions interface to the simple conditions interface, any advanced condition features that you have specified (for example, ranking conditions) are permanently lost. -
Press the Edit button next to the ‘Ranking Conditions’ panel.
-
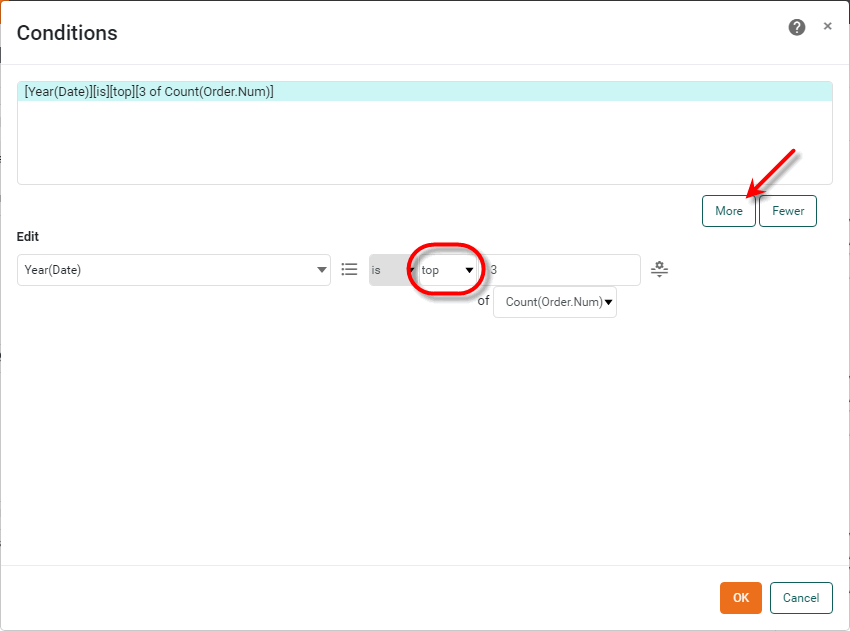
Press the More button. Then use the menus to specify the desired condition.
If the condition you specify references data model attributes that do not already exist in the data block, these attributes are automatically added to the data block as hidden columns.
-
Press Append to add the condition.
-
Optional: To create a compound condition, press the More button again and repeat the above steps to specify another condition clause.
To delete a clause in the condition, select the clause and press the Fewer button. To modify a clause in the condition, select the clause and then specify the clause using the menus (as described above).
-
Press OK to close the dialog box. The selected data set is now filtered to return only the top or bottom records or groups according to the specified measure.
-
To view the filtered data, enable ‘Live Data View’. (See Preview Data.)
-
Save the Data Worksheet by pressing the ‘Save’ button
in the toolbar, or press Ctrl+S on the keyboard.
You can now use this Data Worksheet as the data source for a Dashboard. See Visualize Your Data to create a Dashboard.
Filter Using Dynamic Conditions
There are several different ways to make a data block filtering condition more dynamic by incorporating user input, session data, and so on. The following sections explain these approaches.
| If you want to apply dynamic conditions at the Dashboard level (rather than at the data level), see Filter a Dashboard. |
Use a Variable (Parameter) in a Condition
Watch Video: Filter Data Using Parameters
This video might show an earlier version of the feature or operation that differs in minor ways from the current version.
You can use a variable or parameter as the test value in a filter condition. By default, the user of the Dashboard will be prompted to enter the value of any parameters required by Data Worksheet conditions. The parameter value can also be supplied from other sources (Dashboard parameter or input component, user session data, Dashboard script.)
To use a variable or parameter in a filter condition, follow these steps:
-
Create the data block you want to filter. See Create a Data Worksheet for information on how to create a data block.
-
Optional: To reference a Variable object in the condition, create a new Variable or drag an existing Variable from the Asset panel into the right panel. See Create a New Variable for more about how to create the Variable object.
You do not need to use a Variable object in order to parametrize a condition, but a using Variable object gives you more control over the parameter’s properties and prompting. -
Optional: To control the value of a Variable object from a Dashboard, link a Dashboard Form component to the variable.
How to link a Form component to a Variable…
A user can modify the value of a Variable in the Data Worksheet by using a Dashboard Form component. To configure Dashboard control of a Variable, follow these steps:
-
Open the Dashboard for editing. (See Edit a Dashboard.)
-
Add the desired Form component to the Dashboard. (See Dynamically Set Properties for more information about Form components.)
-
Right-click on the Form component in the Dashboard, and select ‘Properties’.
-
Select the Data tab in the ‘Properties’ panel.
-
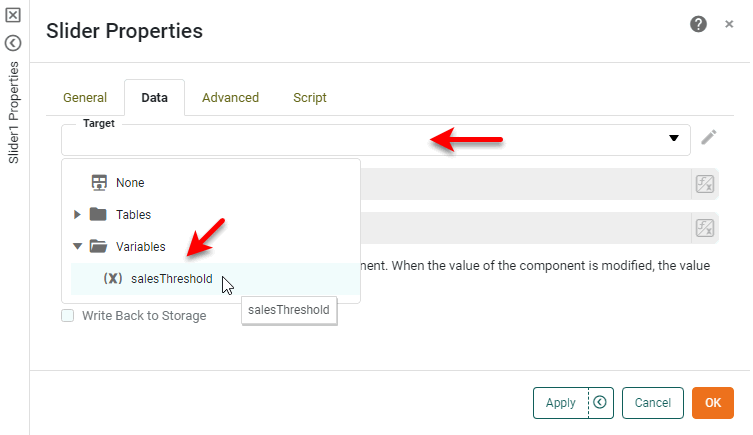
Open the ‘Target’ menu. Expand the ‘Variable’ node, and select the desired Variable asset in the Data Worksheet.
-
Press OK to exit the ‘Properties’ panel.
The Form control is now linked to the Data Worksheet Variable, and changes the user makes using the control will alter the values in the Variable. To set the options displayed by the Form control, see Radio Button/Check Box/Combo Box Properties.
-
-
Click to select the data block that you want to filter.
-
Press the ‘Define Condition’ button
button in the bottom panel.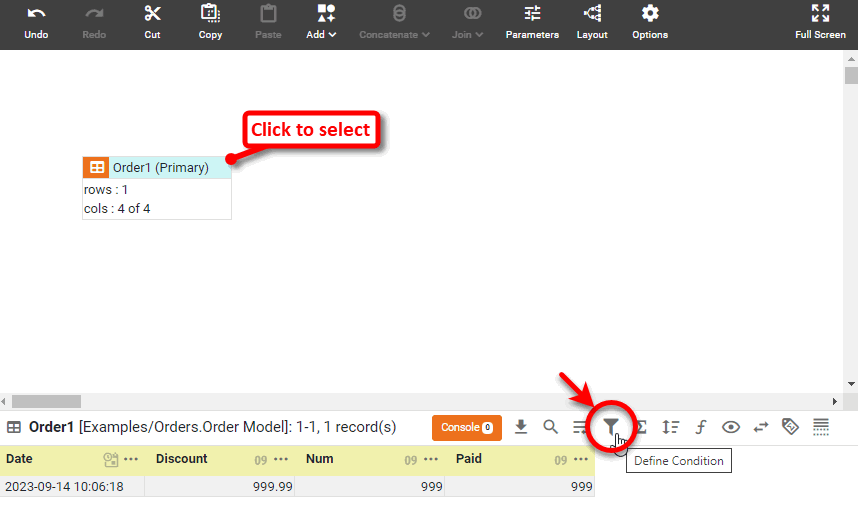
This opens the ‘Condition’ panel.
-
Use simple condition mode (press the More button) or advanced condition mode (select ‘Advanced Conditions’ and press the Edit button for the type of condition you want to create). Advanced conditions allow you to specify both “AND” and “OR” operators, and to perform post-aggregate and ranking filtering.
-
To use a variable in the condition, press the ‘Change Value Type’ button
 and select ‘Variable’. This opens a blank Combo Box on the right side of the condition.
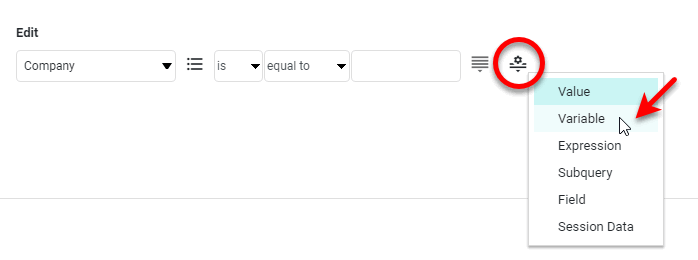
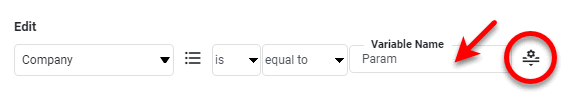
In the Combo Box, do one of the following:
-
Select an existing Variable from the menu. (See Create a New Variable for how to create a new variable.)
-
Type the name of a new parameter.
-
Type the name of a Dashboard Form component. (See Dynamically Set Properties for information about using these components.)
-
-
Press ‘OK’ to close the ‘Condition’ panel.
The Data Worksheet will now prompt for the value of the variable/parameter, and will continue to do so each time the Data Worksheet is freshly accessed. The user will also be prompted for the parameter value by any Dashboard that utilizes the Data Worksheet, unless the Dashboard contains a Form component that sets the value of the parameter. If you need to suppress the parameter prompt in a Dashboard (for example, if you are setting the parameter using script), use the ‘Prompt for Parameters’ property in the Dashboard Options dialog box.
|
If no value is provided for a variable (parameter), it will have a null value. This will cause the condition to be ignored, which generally results in all records being returned. If this is not the desired behavior, you can either test for null parameter values using isNull(object) in onRefresh script (see Add Dashboard Script) and substitute a non-null value, or you can add an
See Use an Expression in a Condition to enter a right-hand side expression such as |

Use Session Data in a Condition
Watch Video: Filter Data Using Session Information
This video might show an earlier version of the feature or operation that differs in minor ways from the current version.
To use a session variable (user, group, or role) as the test value in a filter condition, follow the steps below.
| While session-based conditions can be used to control data access, you should implement comprehensive data security by using a VPM. See Secure Data. |
-
Create the data block you want to filter. See Create a Data Worksheet for information on how to create a data block.
-
Click to select the data block that you want to filter.
-
Press the ‘Define Condition’ button
button in the bottom panel.This opens the ‘Condition’ panel.
-
Use simple condition mode (press the More button) or advanced condition mode (select ‘Advanced Conditions’ and press the Edit button for the type of condition you want to create). Advanced conditions allow you to specify both “AND” and “OR” operators, and to perform post-aggregate and ranking filtering.
-
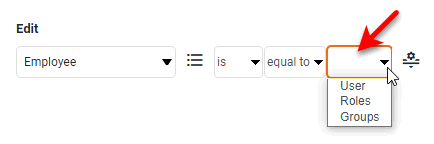
Press the ‘Change Value Type’ button
and select ‘Session Data’. This opens a menu on the right side of the condition.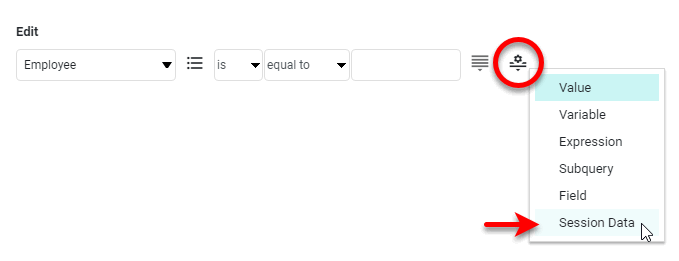
-
In the menu, choose one of ‘User’, ‘Roles’, or ‘Groups’. These parameters return information about the user who is currently accessing the Data Worksheet; respectively, the user name, the array of roles to which the user belongs, and the array of groups to which the user belongs.
Note that the adjacent menu automatically chooses the ‘equal to’ or ‘one of’ operator to match your selection.
-
Press OK to close the ‘Condition’ panel.
Use a Field in a Condition
Watch Video: Filter Data Using a Field Comparison
This video might show an earlier version of the feature or operation that differs in minor ways from the current version.
You can create a filter condition that compares values from two columns (fields) in the same row of data block. To use a data block field in a filter condition, follow these steps:
-
Create the data block you want to filter. See Create a Data Worksheet for information on how to create a data block.
-
Click to select the data block that you want to filter.
-
Press the ‘Define Condition’ button
button in the bottom panel.This opens the ‘Condition’ panel.
-
Use simple condition mode (press the More button) or advanced condition mode (select ‘Advanced Conditions’ and press the Edit button for the type of condition you want to create). Advanced conditions allow you to specify both “AND” and “OR” operators, and to perform post-aggregate and ranking filtering.
-
Press the ‘Change Value Type’ button
and select ‘Field’. This opens a menu on the right side of the condition.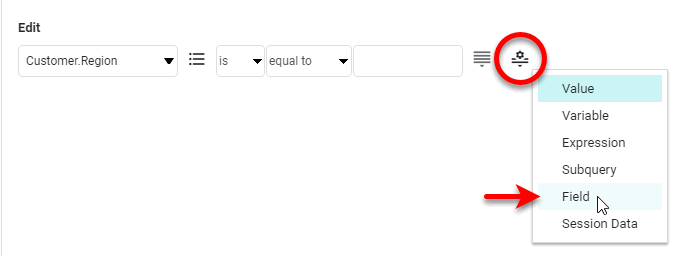
-
Select the column containing the values to test.
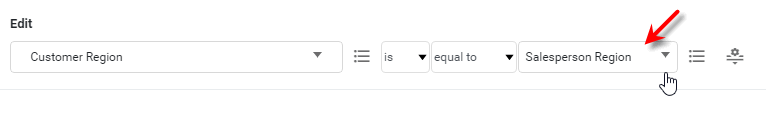
The condition compares corresponding values in the selected columns (left-most menu and right-most menu), and returns only rows that satisfy the condition.
-
Press OK to close the ‘Condition’ panel.
Use an Expression in a Condition
Watch Video: Filter Data Using an Expression
This video might show an earlier version of the feature or operation that differs in minor ways from the current version.
To use a SQL or a JavaScript expression in a filtering condition, follow the steps below:
-
Create the data block you want to filter. See Create a Data Worksheet for information on how to create a data block.
-
Click to select the data block that you want to filter.
-
Press the ‘Define Condition’ button
button in the bottom panel.This opens the ‘Condition’ panel.
-
Use simple condition mode (press the More button) or advanced condition mode (select ‘Advanced Conditions’ and press the Edit button for the type of condition you want to create). Advanced conditions allow you to specify both “AND” and “OR” operators, and to perform post-aggregate and ranking filtering.
-
Press the ‘Change Value Type’ button
and select ‘Expression’. This displays a blank text field on the right side of the condition.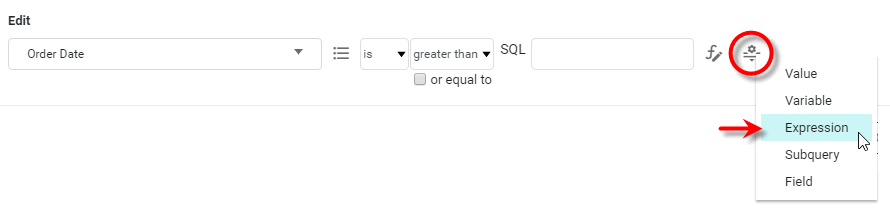
-
Press the ‘SQL’ or ‘JS’ button at the left of the text field to choose the expression type.
Expressions that use SQL syntax are processed by the database, while expressions that use JavaScript syntax are post-processed. Because post-processing is CPU-intensive for the query engine, and may additionally cause retrieval of a large amounts of raw data, it is preferable to use SQL syntax when possible. Note, however, that SQL functions are database-specific and vary from one database to another.
Use SQL expressions whenever possible. -
Press the ‘Edit Formula’ button
 to launch the Formula Editor and enter your expression.
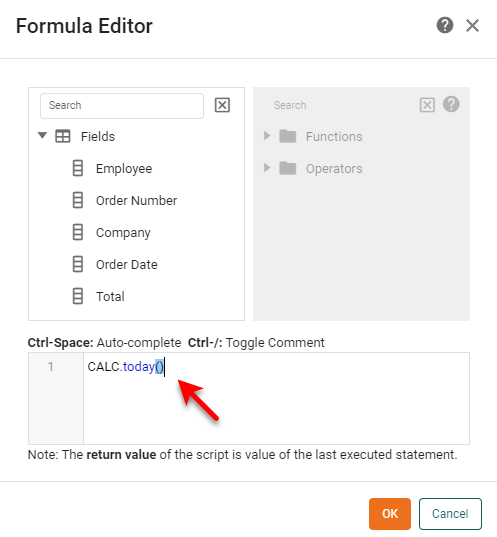
For example, to retrieve orders placed before today, you can use one of the following conditions:
SQL[Order Date][is][less than][Expression:SQL[CURRENT_TIMESTAMP]]JavaScript[Order Date][is][less than][Javascript:[CALC.today()]] -
Press OK to close the Editor.
-
Press OK to close the ‘Condition’ panel.
Use a Subquery in a Condition
You can use a subquery to specify a filter condition that is constructed dynamically at runtime based on data supplied by a desired query. To enter a subquery in a filter condition, follow these steps:
-
Create the data block you want to filter. See Create a Data Worksheet for information on how to create a data block.
-
In the Asset panel, find the query that you want to use as a subquery in the condition. Drag it from the Asset panel into the Data Worksheet. This creates a new data bock with the name of the query.
If you do not add an appropriate subquery data block to the Data Worksheet as described above, you will not be able to create the subquery condition. -
Click to select the data block that you want to filter.
-
Press the ‘Define Condition’ button
button in the bottom panel.This opens the ‘Condition’ panel.
-
Use simple condition mode (press the More button) or advanced condition mode (select ‘Advanced Conditions’ and press the Edit button for the type of condition you want to create). Advanced conditions allow you to specify both “AND” and “OR” operators, and to perform post-aggregate and ranking filtering.
-
Press the ‘Change Value Type’ button
and select ‘Subquery’. This displays the ‘Subquery’ button.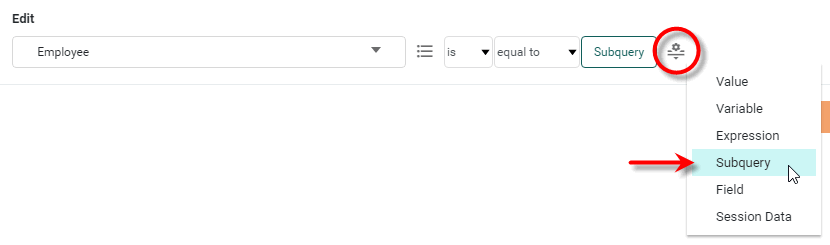
-
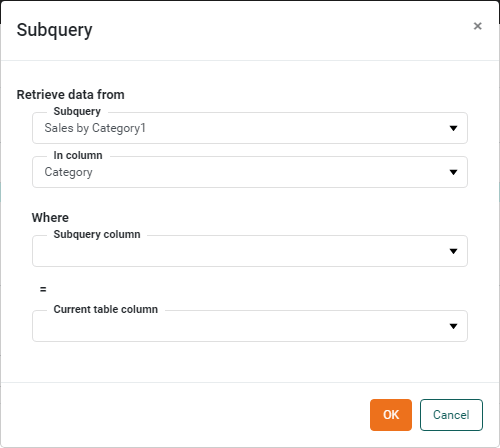
Press the ‘Subquery’ button to open the ‘Subquery’ dialog box.
-
In the ‘Subquery’ menu, specify the desired subquery data block. (This is the data block created when you dragged the query from the Asset panel to the right panel.)
-
Select options in the lower three menus, as needed. You do not need to make a selection in every menu; this depends on how you want to use the subquery result. The ‘In column’ menu specifies the subquery column that contains the result set to use in the condition. The bottom two menus control table synchronization for row-dependent conditions.
How to use the menus to create different kinds of subqueries…
You do not need to specify every setting in the ‘Subquery’ dialog box. The required menu choices depend on how you wish to use the subquery result set. This section explains three different ways that you can use a subquery.
- Subquery Returns a Fixed Value
-
If the subquery returns a single fixed value (i.e., the subquery data block in the Data Worksheet contains a single data cell), then in the ‘Subquery’ dialog box you only need to specify the name of the subquery. No further settings are required.
- Subquery Returns a Fixed List
-
If you want to use a particular column from the subquery as a fixed list in the condition, you need to specify the query name in the ‘Subquery’ dialog box, and then select the desired subquery column from the ‘In column’ menu. A subquery that returns a column is typically used in conjunction with the ‘one of’ condition operator to filter values that are members (or non-members) of the returned list. For this usage, you do not need to make selections in the ‘Subquery column’ and ‘Current table column’ menus. See the Subquery Returns a Fixed List example below.
- Subquery Returns a Row-Dependent Value
-
A subquery can return a value that is dependent on the row of the filtered data block. Such a row-dependent subquery is useful when you want to filter rows of a data block based on comparison with corresponding rows of the subquery.
For example, consider a case where one data bock returns sales by year for NY, and a second data block returns sales by year for CA. You want the NY data block to return records only for those years where sales were greater than sales in CA. For instance, you want the NY data block to return a record for year 2002 only if sales in NY for 2002 were greater than sales in CA for 2002.
To configure a row-dependent subquery, follow these steps:
-
Select the desired subquery column from the ‘In column’ menu. This is the column of the subquery containing the actual values to be tested in the condition. (In the example above, this would be the ‘sales’ column of the CA data block, since this column contains the values that the condition will test.)
-
From the ‘Subquery column’ menu, select the column in the subquery data block that indexes the subquery condition column (selected in the previous step). The ‘Subquery column’ is the subquery join column; it will be used to look up the condition values corresponding to a particular row in the filtered data block. (In the example above, the ‘Subquery column’ would be the ‘year’ column of the CA data block, since this is the column that indexes the ‘sales’ column of the CA data block.)
-
From the ‘Current table column’ menu, select the column in the filtered data block that contains the indexing values corresponding to those in the ‘Subquery column’ of the subquery data block. (In the example above, the ‘Current table column’ would be the ‘year’ column of the NY data block, since this is the column that corresponds to the CA ‘year’ column.)
The ‘Subquery column’ and ‘Current table column’ link the subquery data block and filtered data block. For each row in filtered data block, the value in the ‘Current table column’ is matched against the values in the ‘Subquery column’. The results returned by the subquery for each row are the values of the condition ‘In column’ in the rows where the ‘Subquery column’ value is matched. See the Subquery returns a row-dependent value example below.
-
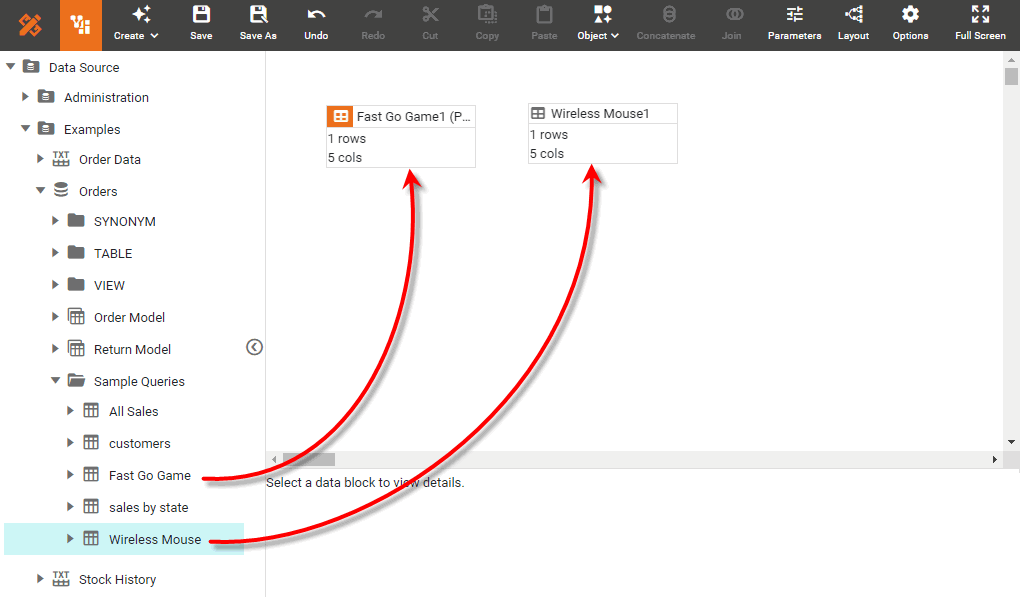
Example 1. Subquery Returns a Fixed ListAssume that you have a data block returning companies that purchased a ‘Wireless Mouse’ product, and a second data block returning companies that purchased a ‘Fast Go Game’ product. You would like to filter the ‘Wireless Mouse’ data to show only the companies that did not purchased the ‘Fast Go Game.’ To do this, define a condition on the ‘Wireless Mouse’ data bock that uses the ‘Fast Go Game’ data as a subquery.
Follow the steps below:
-
Create a new Data Worksheet. For information on how to create a new Data Worksheet, see Create a Data Worksheet.
-
Drag the ‘Fast Go Game’ Data Worksheet from the left panel into the right panel. This creates a new data block named ‘Fast Go Game1’.
The ‘Fast Go Game’ and ‘Wireless Mouse’ Data Worksheets can be found in the folder. You may need to download the examples.zip file from GitHub into your environment. (This requires access to Enterprise Manager.) See Import and Export Assets for instructions on how to import. -
Drag the ‘Wireless Mouse’ Data Worksheet from the left panel into the right panel. This creates a new data block named ‘Wireless Mouse1’.
-
In the ‘Fast Go Game1’ data block, rename the ‘Customers’ column to ‘Customers_FGG’. This will make the next steps more clear. See Modify a Column for how to rename a column.
Names must be unique without respect to case (e.g., "num1" is the same name as "Num1"). -
Click the ‘Wireless Mouse1’ data block to select it.
-
Press the ‘Define Condition’ button
button in the bottom panel.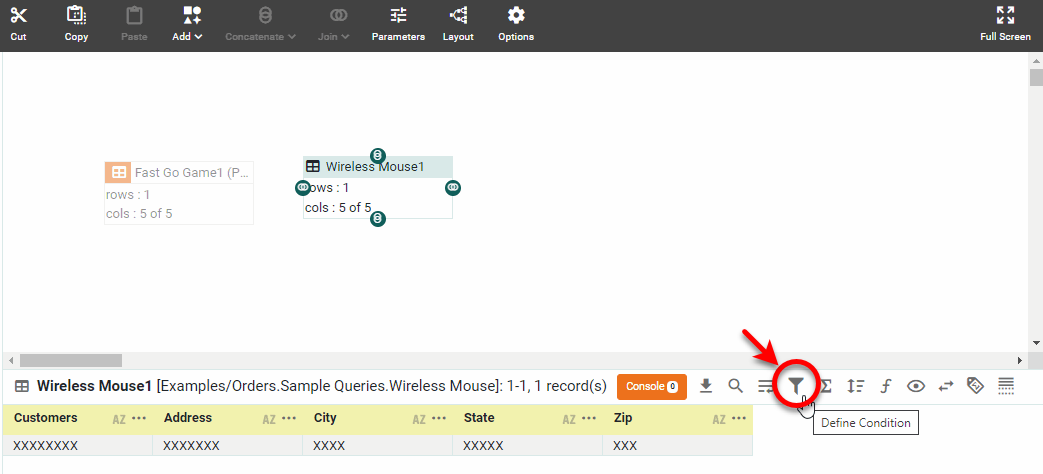
This opens the ‘Condition’ panel.
-
Press the More button.
-
Use the menus to specify the following expression:
[Customers] [is not] [one of]
-
To use a subquery in the condition, press the ‘Change Value Type’ button
and select ‘Subquery’. This displays the Subquery button.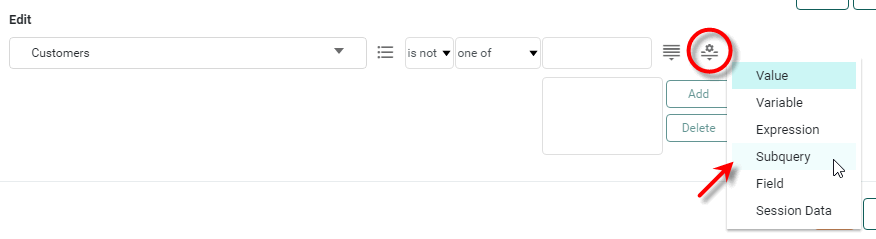
-
Press the Subquery button to open the ‘Subquery’ dialog box.
-
Select ‘Fast Go Game1’ from the ‘Subquery’ menu. This is the name of the subquery data block.
-
Select ‘Customers_FGG’ from the ‘In column’ menu. This is the column of the subquery that contains the list of values to use in the condition expression.
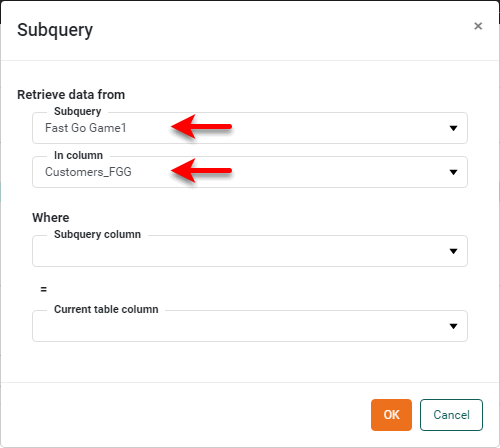
-
Press OK to close the ‘Subquery’ dialog box. (You do not need to make selections from the bottom two menus.)
-
Press OK to exit the ‘Condition’ panel. The data blocks are now linked by a sub-query link
 to indicate that the ‘Fast Go Game1’ data block provides a subquery result to the ‘Wireless Mouse1’ data block.
 -
Preview the data returned by the ‘Wireless Mouse1’ data block. (Click the data block to select it. Then press the ‘Change View’ button
in the bottom panel and select ‘Live Data View’ .)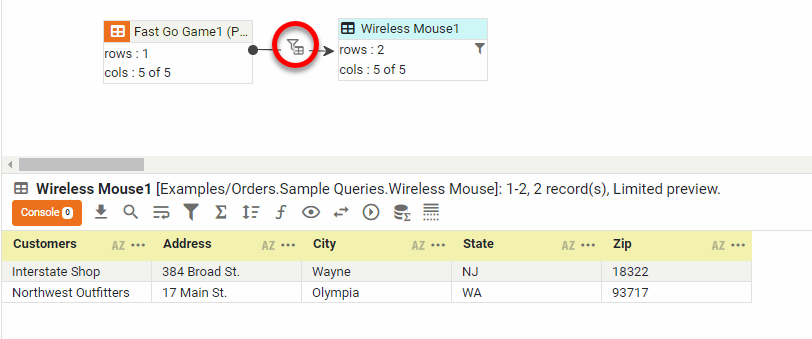
The ‘Wireless Mouse1’ data is filtered to display only the companies that did not purchase the ‘Fast Go Game’.
Example 2. Subquery returns a row-dependent valueThis example illustrates how to use a row-dependent subquery. Suppose you have the total sales for all product categories, both for this week and last week. However, you want to display only those product categories that have yielded more sales revenue this week than last week. To do this, you can use last week’s total sales as a subquery to provide the data for the condition you place on this week’s sales table.
Follow the steps below:
-
Create a new Data Worksheet.
For information on how to create a new Data Worksheet, see Create a Data Worksheet.
-
Create the ‘Sales this week’ data block:
-
Expand the sample Order Model, and drag the ‘Category’ and ‘Total’ columns from the ‘Product’ entity to create a new data block.
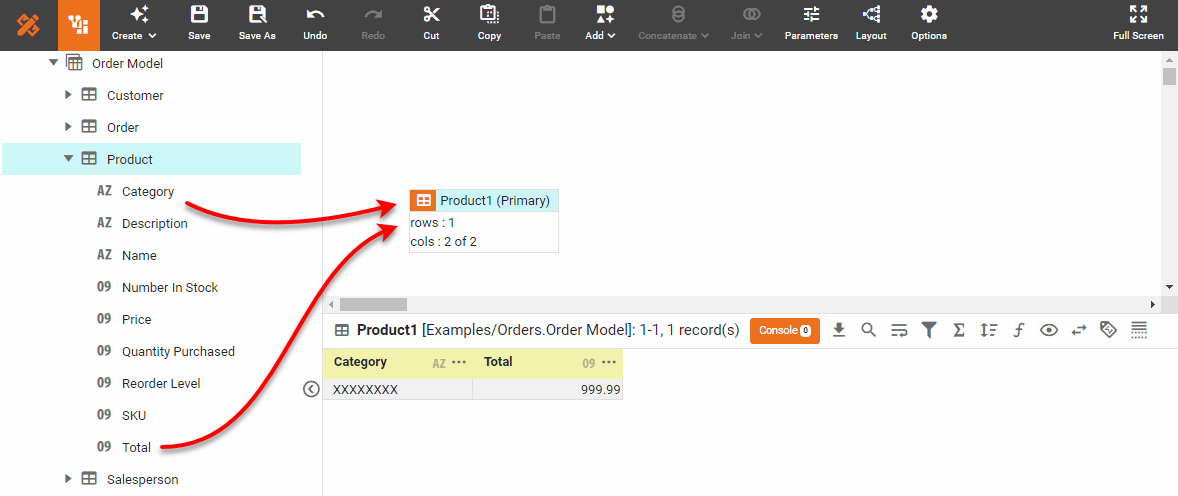
The ‘Order Model’ data model can be found in the folder. You may need to download the examples.zip file from GitHub into your environment. (This requires access to Enterprise Manager.) See Import and Export Assets for instructions on how to import. -
Double click the data block title bar, and rename the data block ‘Sales this week’.
-
Press the ‘Define Condition’ button
in the bottom panel to open the Condition panel.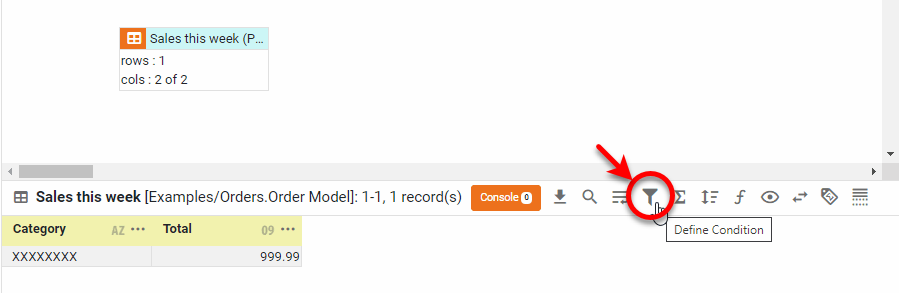
-
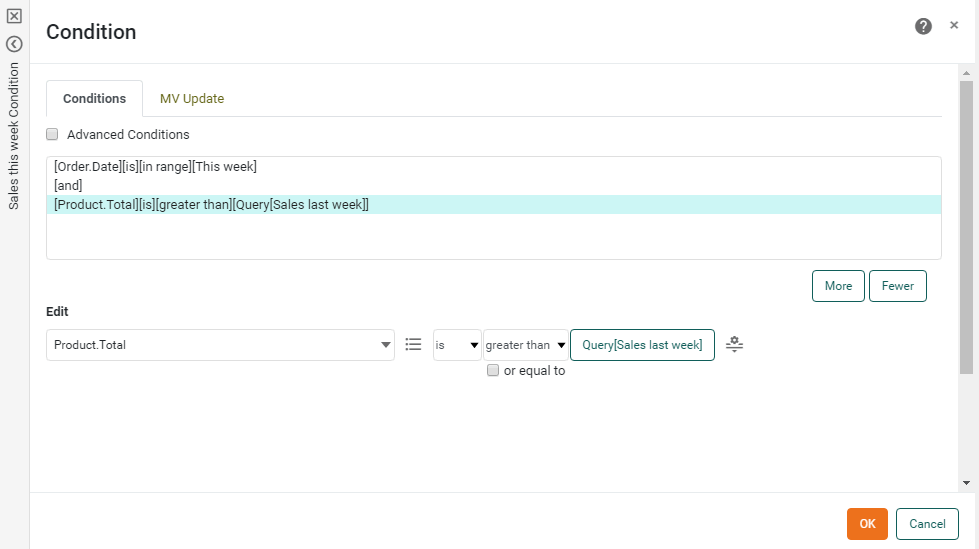
Press the More button and enter the following condition:
[Order Date] [is] [in range] [This week].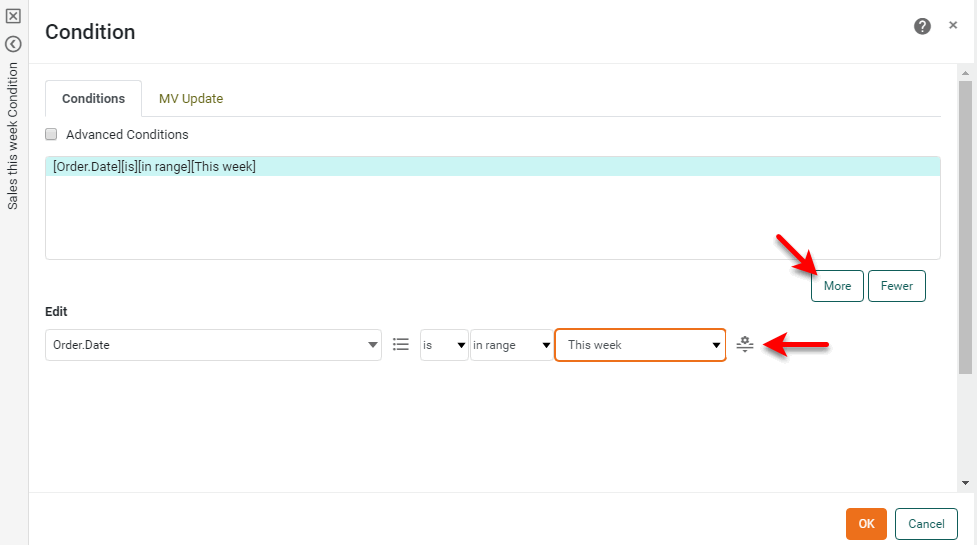
-
Press OK.
-
Press the ‘Group and Aggregate’ button
 in the bottom panel to open the Group and Aggregate panel.
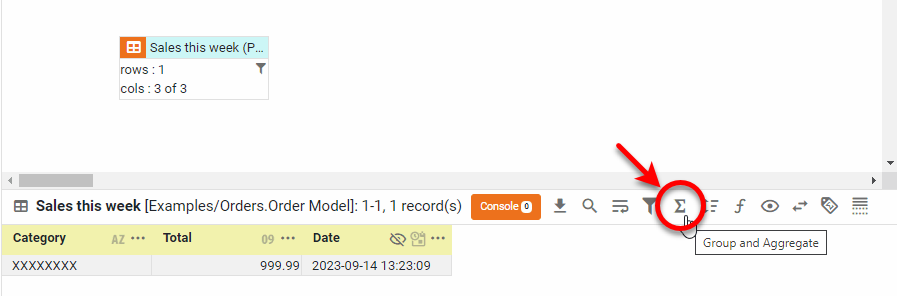
-
Set the data block to group by ‘Category’ and aggregate by ‘Total’. Then press OK.
-
-
Create the ‘Sales last week’ data block:
-
Make a copy of the ‘Sales this week’ data block. (See Copy Data for more information.)
-
Rename the copy ‘Sales last week’.
-
Change the condition on the ‘Sales last week’ data block to the following:
[Order Date] [is] [in range] [Last week]. -
In the bottom panel, double-the ‘Category’ column header, and change the name to ‘Category_LW’. (This will avoid confusion with the ‘Category’ column in the other data block.)
-
In the same way, rename the ‘Total’ column to ‘Total_LW’.
-
-
Click the ‘Sales this week’ data block to select it. Press the ‘Define Condition’ button
in the bottom panel. This opens the Condition panel again.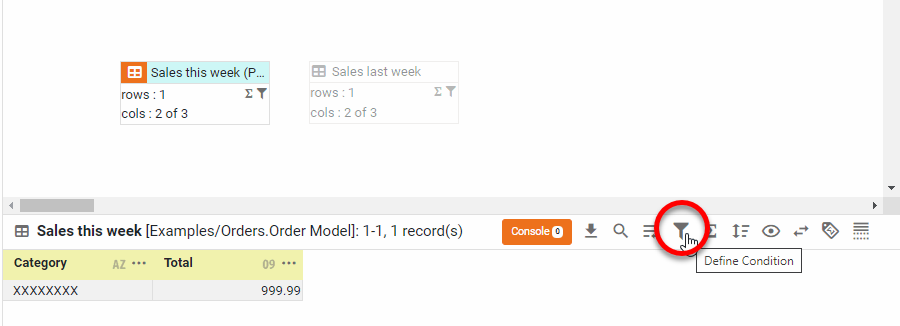
-
Press the More button.
-
Use the menus to specify the following expression:
[Product.Total] [is] [greater than]. -
Press the ‘Change Value Type’ button
and select ‘Subquery’.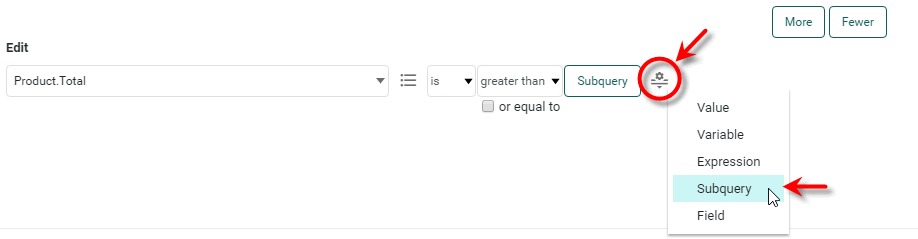
-
Press the Subquery button. This opens the ‘Subquery’ dialog box.
-
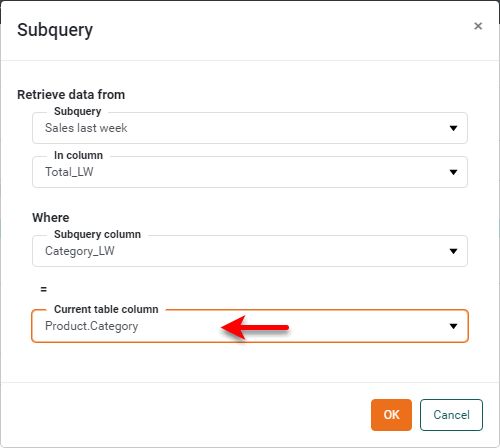
Select ‘Sales last week’ from the ‘Subquery’ menu.
-
Select ‘Total_LW’ from the ‘In column’ menu. This is the column of the subquery containing the values to be used in the condition test.
-
Select ‘Category_LW’ from ‘Subquery column’. This is the subquery column that will be matched up against the ‘Current table column’ in the filtered data block. (It is the “join column” of the subquery data block.)
-
Select ‘Product.Category’ from the ‘Current table column’ menu. This is the filtered data block column that will be matched up against the ‘Subquery column’ in the subquery data block. (It is the “join column” of the filtered data block.)
-
Press OK to close the ‘Subquery’ dialog box to return to the Condition panel.
-
Press OK in the Condition panel. The two data blocks are now shown with a sub-query link
, indicating that the ‘Sales this week’ data block relies on subquery data from the ‘Sales last week’ data block.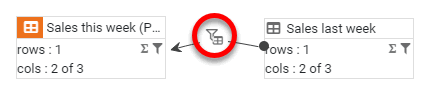
-
Preview the data in the ‘Sales this week’ data block. (Select the data block. Then press the ‘Change View’ button
button in the bottom panel, and select ‘Live Data View’ .)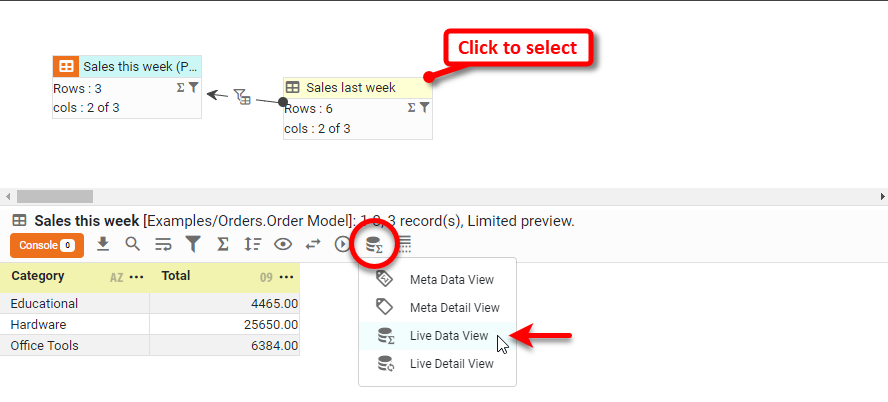
Note that the filtered ‘Sales this week’ data block now contains only the categories for which sales were higher than the previous week. (In this example, only the category of ‘Hardware’ had higher sales this week.)
-
Press OK to close the ‘Subquery’ dialog box, and press OK to close the ‘Condition’ panel.
Filter Materialized View Data
You can create conditions for a data block that determine how and when the data block’s materialized view is updated. A materialized view is a high-performance caching mechanism for Dashboards. (See Materialized View for background on incremental updates.)
To specify the materialized view update conditions for a data block, follow the steps below:
-
Click the data block to select it.
-
Press the ‘Define Condition’ button
button in the bottom panel. This opens the ‘Condition’ panel.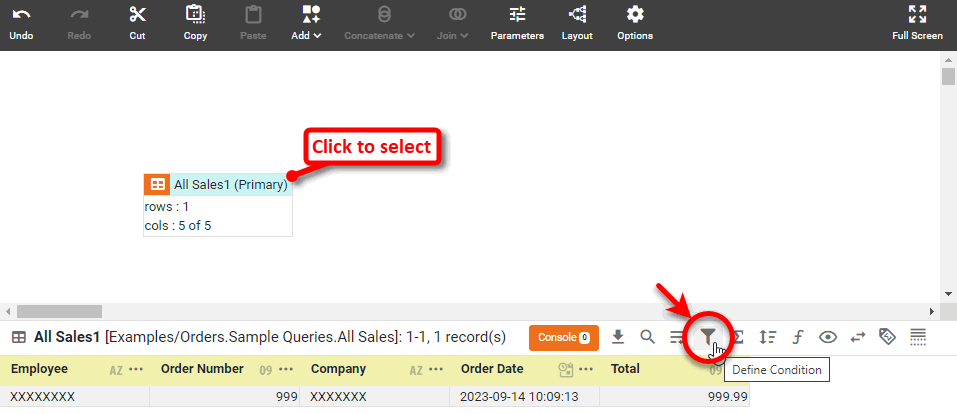
-
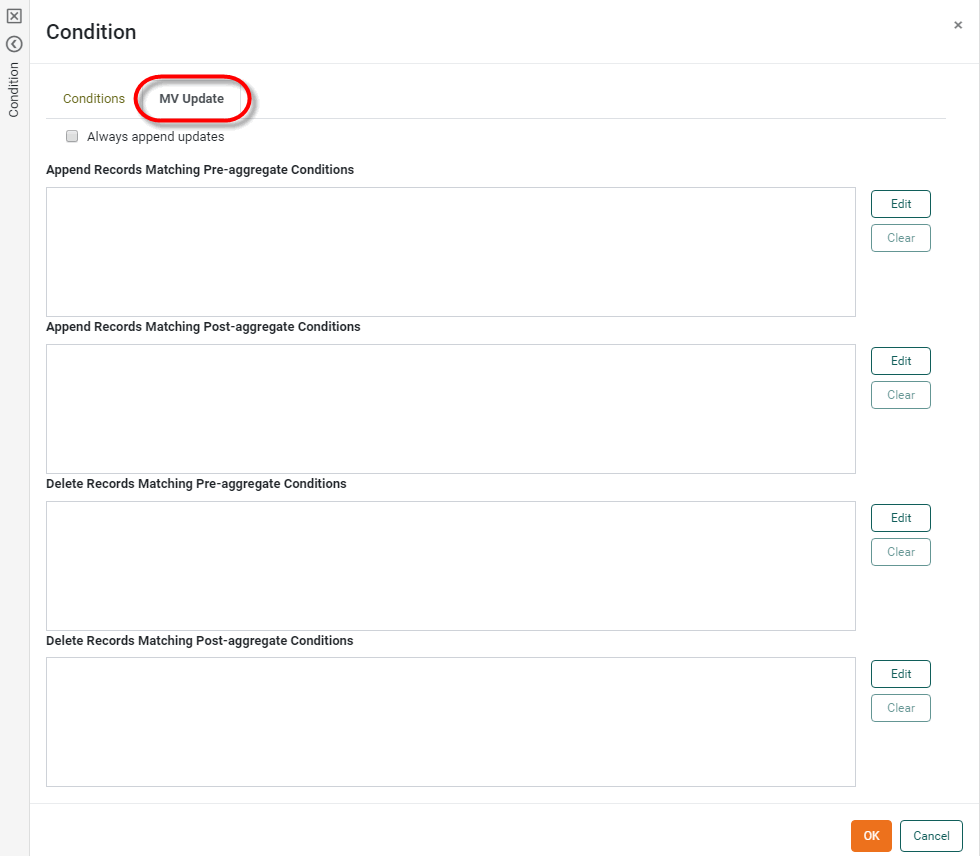
Select the MV Update tab.
-
In the special case where you are using an unmergeable query, enable the ‘Always append updates’ option. Otherwise, leave it disabled. See Materialized View for information about using this property for unmergeable queries.
-
Press the Edit button corresponding to the type of update condition you wish to create. The available options are as follows:
- Append Records Matching Pre-aggregate Condition
-
Create a condition which selects records to add to the existing materialized view based on the pre-aggregate values of data (prior to grouping and summarization).
- Append Records Matching Post-aggregate Condition
-
Create a condition which selects records to add to the existing materialized view based on the post-aggregate values of data (subsequent to grouping and summarization).
- Delete Records Matching Pre-aggregate Condition
-
Create a condition which selects records to delete from the existing materialized view based on the pre-aggregate values of data (prior to grouping and summarization).
- Delete Records Matching Post-aggregate Condition
-
Create a condition which selects records to delete from the existing materialized view based on the post-aggregate values of data (subsequent to grouping and summarization).
When you press the desired Edit button, this opens the ‘Conditions’ dialog box.
-
Use the menus to enter the desired condition. (See above for general information on specifying conditions.)
To prevent a delete condition from being applied on the initial materialized view generation, add the following special tag into the expression script: //@incrementalOnly.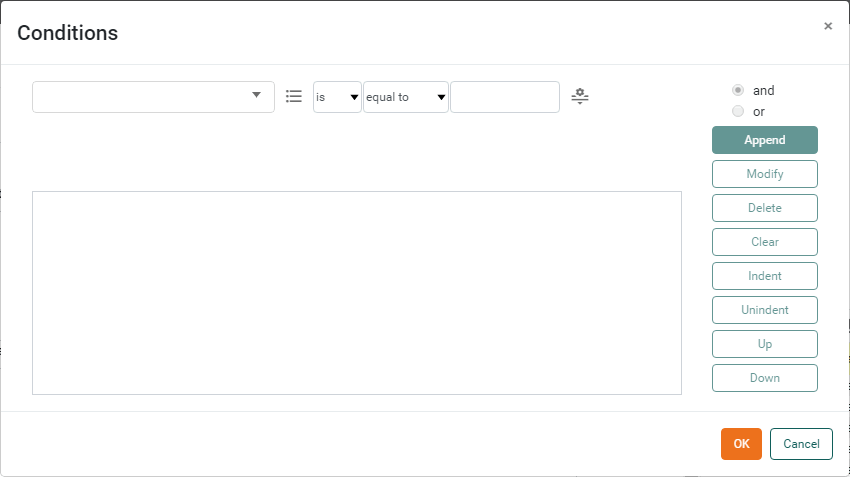 If you select the ‘Expression’ option for the right side of the condition, follow the additional steps below:
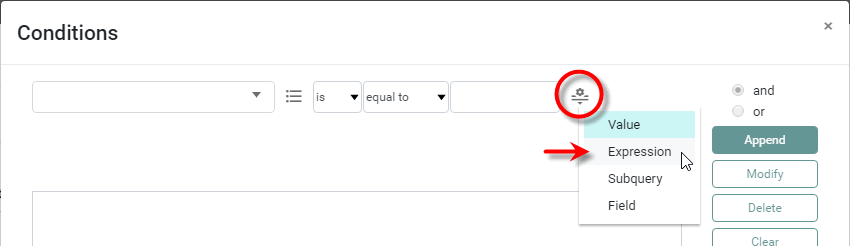
-
For append operations, press the SQL/JS button to select the desired expression language, SQL or JavaScript.
The SQL/JS option is not available for deletions. Deletion expressions must use JavaScript syntax. -
Press the ‘Edit Formula’ button
. This opens the Formula Editor. -
Enter the desired expression. You can use any available functions and operators, in addition to the special parameters
MV.LastUpdatedTime,MV.MaxValue, andMV.MinValue.- MV.LastUpdatedTime
-
This represents the time at which the materialized view for the data block was last updated. You can use this value in a condition expression to incrementally update the materialized view with records that have posted to the database since the last materialized view update. For example, the condition below updates the current materialized view with records having a “transaction date” subsequent to the previous materialization.
[transaction_date][is][greater than][MV.LastUpdatedTime]
- MV.MaxValue
-
This represents the maximum value of the field specified in the left-side menu of the materialized view condition. For example, in the condition below,
MV.MaxValuerepresents the maximum value of the ‘Total’ field.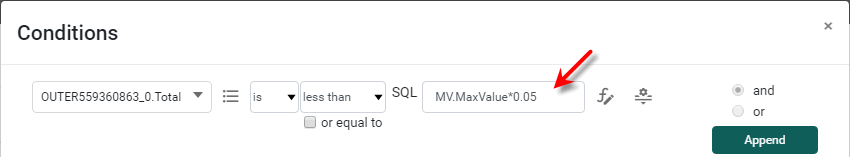
- MV.MinValue
-
This represents the minimum value in the field specified in the left-side menu of the materialized view condition.
-
Press OK to close the Formula Editor.
-
-
Press OK to close the ‘Condition’ panel.
The specified condition(s) will be evaluated when any materialized view based on this data block is regenerated. The materialized view will be updated in accordance with the conditions specified. In general, incrementally updating a materialized view in this way is significantly faster than regenerating the materialized view in its entirety.