R Query
To create a new data set from an existing R connection, follow the steps below:
-
If you have not yet configured the database connection, see R. Then proceed with the steps below.
If you see the ‘Create Visualization’ dialog box, press the ‘Close’ button
 to continue with the steps below (recommended).
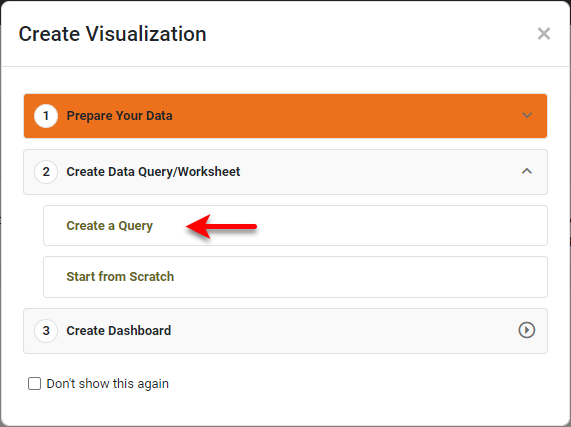
You can also press Create a Query to open the ‘New Data Worksheet’ dialog box, where you can select the query you wish to create. This allows you to skip the ‘Add’ button
 and proceed to the next steps.
 -
Open the Data Worksheet that will contain the data. (See Create a Data Worksheet or Edit a Data Worksheet.)
-
Press the ‘Add’ button
, and select ‘R Query’  .
.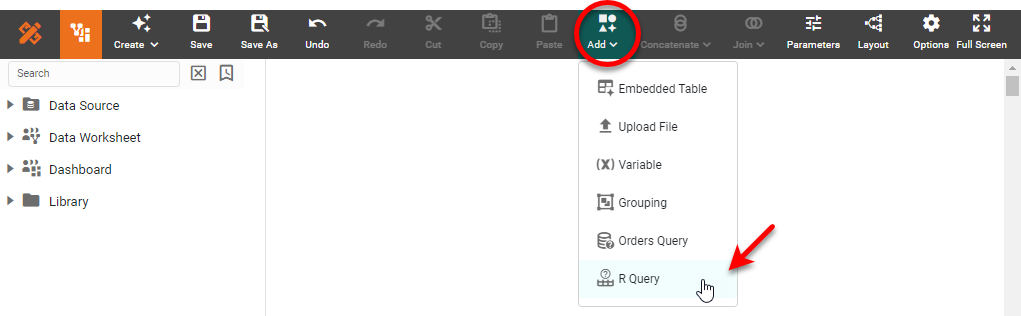
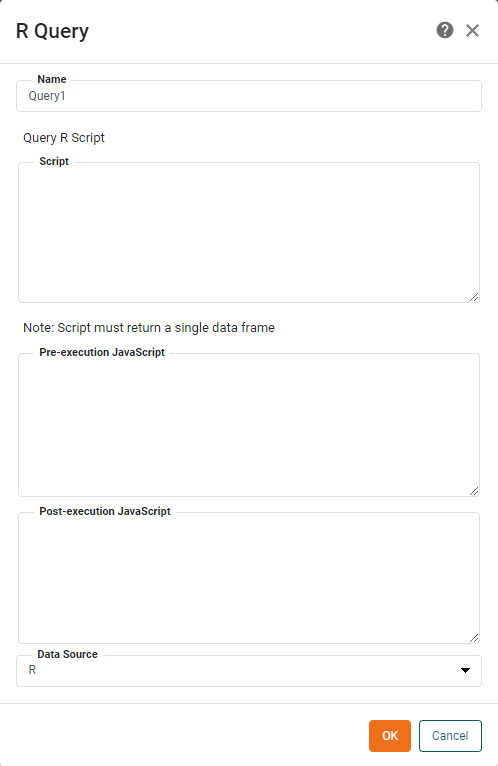
This opens the ‘R Query’ dialog box.
-
Enter the desired R script. This can be simply the name of the data set (e.g., “iris”) or a more elaborate analysis script.
If the last statement in the script is a data frame, this data is returned in full by the script. For large data sets, this may result in high memory consumption. To avoid this, the script can also return a string containing the name of a variable that points to a data frame. The data will then be streamed from a temporary CVS file to the Data Worksheet, with reduced memory consumption. -
Optional: In the ‘Pre-execution JavaScript’ field, enter a script to write data from data blocks and variables in the Data Worksheet into the R session. Use variable
rto do this. For example, to create data framein_datain the R session containing the data from Worksheet data block ‘Query1’, use the following pre-execution script:r.in_data = Query1;
To create a variable
my_paramin the R session containing the value from Worksheet variable ‘InputVar’, use the following pre-execution script:r.my_param = parameter.InputVar;
-
Optional: In the ‘Post-execution JavaScript’ field, enter a script to write data from the R session into a Worksheet Embedded Table. Use variable
rto do this. For example, to write a data frameresidualsfrom the R session into Worksheet Embedded Table ‘Residuals’, use the following post-execution script:Residuals.table = r.residuals;
To write the value of variables
rmseandmapefrom the R session into Worksheet Embedded Table ‘Accuracy’, use the following post-execution script:Accuracy.table = [ [ "RMSE", "MAPE" ], [ r.rmse, r.mape ] ]; -
Press OK. This creates a new data block in the Data Worksheet.
-
Optional: Right-click on the data block, and select ‘Properties’ from the context menu. Note: You can also access menu options from the ‘More’ button (
 ) in the mini-toolbar. This opens the ‘Table Properties’ panel. In the ‘Name’ field, enter a name for the data block, and press ‘OK’. (See Modify a Column for information about how to rename columns.
Names must be unique without respect to case (e.g., "num1" is the same name as "Num1"). -
Press the ‘Save’ button
 in the toolbar to save the Data Worksheet.
You can now do pipeline operations on this data, as described in Prepare Your Data, or you can proceed to create Dashboards based on this Data Worksheet. See Visualize Your Data for information about how to construct a Dashboard.