GraphElement.setCollisionModifier(value)
Specifies how collisions (elements occupying the same location) should be handled. The corresponding “getter” function is getCollisionModifier().
Parameter
- value
-
One of the following constants:
GraphElement.MOVE_NONE    (do not stack/center)
GraphElement.MOVE_CENTER  (center, do not stack)
GraphElement.MOVE_DODGE   (offset horizontal)
GraphElement.MOVE_STACK   (offset vertical (stack))
GraphElement.MOVE_JITTER  (random offset (points))
GraphElement.DODGE_SYMMETRIC  (offset horiz, center)
GraphElement.STACK_SYMMETRIC  (offset vert, center)
Examples
Chart Component Script
dataset = [["State", "Quantity"],["NJ", 200],["NJ", 300],["NY", 300],["NY", 100]]; (1)
graph = new EGraph();
var elem = new IntervalElement("State", "Quantity"); (2)
var scale = new LinearScale("Quantity");
var frame = new HeatColorFrame();
frame.setField("Quantity");
elem.setColorFrame(frame);
elem.setStackGroup(true);
elem.setCollisionModifier(GraphElement.STACK_SYMMETRIC); (3)
graph.addElement(elem); (4)| 1 | See dataset to use a data block instead of an array literal. |
| 2 | Create the IntervalElement object. |
| 3 | Use setCollisionModifier to set stacking. |
| 4 | Use addElement to add the IntervalElement to the Chart. |
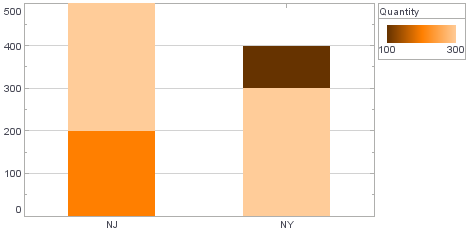
Chart Component Script
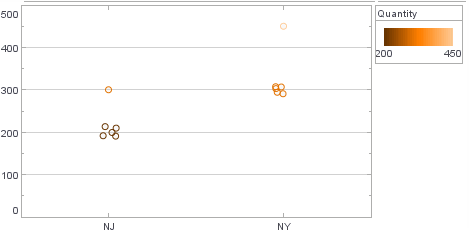
dataset = [["State","Quantity"],["NJ",200],["NJ",200],["NJ",200],["NJ",200],["NJ",200],["NJ",300],
["NY",300],["NY",300],["NY",300],["NY",300],["NY",300],["NY",450]]; (1)
graph = new EGraph();
var elem = new PointElement("State", "Quantity"); (2)
var frame = new HeatColorFrame();
frame.setField("Quantity");
elem.setColorFrame(frame);
elem.setStackGroup(true);
elem.setCollisionModifier(GraphElement.MOVE_JITTER); (3)
graph.addElement(elem); (4)| 1 | See dataset to use a data block instead of an array literal. |
| 2 | Create the PointElement object. |
| 3 | Use setCollisionModifier to jitter the points. |
| 4 | Use addElement to add the PointElement to the Chart. |
Script that modifies the graph or dataset properties should be placed on the Chart component itself. See Add Component Script for more information. This script has access to the Chart data and Chart API methods. Scripted Charts are not good candidates for user-modification, so you should deselect ‘Enable Ad Hoc Editing’ in the Chart Properties dialog box.
|
|
To change the property on a Chart that was previously created with the Chart Editor, use “getter” methods such as EGraph.getElement(index) ① to obtain a handle to the desired GraphElement object. For example: |