AxisSpec.setGridAsShape(Boolean)
Specifies whether axis grid lines are represented as shapes or positions. If represents as shapes, the grid lines can be transformed into curves under a coordinate transformation (for example, transformation of rectangular to polar coordinates). Otherwise, the grid lines remain straight, and only the endpoints are transformed.
Parameter
- Boolean
-
true: grid lines represented as shape (default)
false: grid lines represented as position
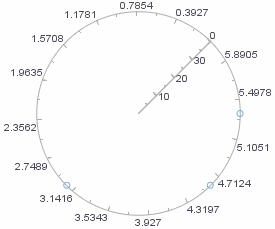
Example
Chart Component Script
dataset = [["Direction", "Score"],[(Math.PI/2),20],[(Math.PI/4),30],[(Math.PI),35]]; (1)
graph = new EGraph();
var elem = new PointElement("Direction", "Score");
var xscale = new LinearScale("Direction");
var yscale = new LinearScale("Score");
yscale.setMin(0);
yscale.setMax(40);
xscale.setMin(0);
xscale.setMax(1.95*Math.PI);
xscale.setIncrement(Math.PI/8);
var rect = new RectCoord(xscale,yscale);
var polar = new PolarCoord(rect); (2)
polar.rotate(45); (3)
polar.setType(PolarCoord.THETA);
graph.setCoordinate(polar); (4)

graph.addElement(elem);| 1 | See dataset to use a data block instead of an array literal. |
| 2 | Create the Coordinate object. |
| 3 | Use rotate to rotate the polar coordinates 45°. |
| 4 | Use EGraph.setCoordinate(coord) to add the Coordinate to the Chart. |
Script that modifies the graph or dataset properties should be placed on the Chart component itself. See Add Component Script for more information. This script has access to the Chart data and Chart API methods. Scripted Charts are not good candidates for user-modification, so you should deselect ‘Enable Ad Hoc Editing’ in the Chart Properties dialog box.
|