VineShapeFrame
The VineShapeFrame object contains the shape styles for three-dimensional “vine” elements. To create a VineShapeFrame object, call the VineShapeFrame constructor.
var frame = new VineShapeFrame("m1","m2","m3");You can pass the name of a field (e.g., ‘m1’, ‘m2’, ‘m3’) to the constructor, or specify this later using the inherited MultiShapeFrame.setFields(arr) property. The dimensions are specified in the following order: [angle, magnitude, radius].
- Angle
-
The angle of the stem line
- Magnitude
-
The length of the stem line
- Radius
-
The radius of the circle
VineShapeFrame provides the special VineShapeFrame.setStartAngle(value) and VineShapeFrame.setEndAngle(value) methods.
Example
Chart Component Script
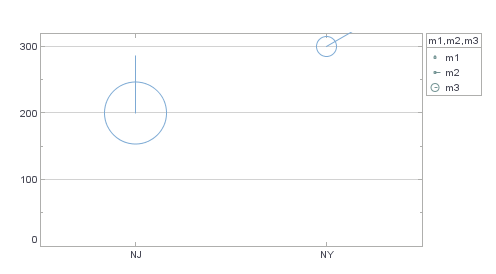
dataset = [["State", "Quantity", "m1", "m2", "m3"],["NJ", 200,90,25,50],["NY", 300,30,15,15]]; (1)
graph = new EGraph();
var elem = new PointElement("State", "Quantity");
var frame = new VineShapeFrame(); (2)
var mscale = new LinearScale();
var rscale = new LinearScale();
mscale.setMin(0);
mscale.setMax(5);
rscale.setMin(0);
rscale.setMax(90);
frame.setScales([rscale, mscale, mscale]);
frame.setFields(["m1", "m2", "m3"]);
frame.setStartAngle(0);
frame.setEndAngle(90); (3)
elem.setShapeFrame(frame); (4)
graph.addElement(elem);| 1 | See dataset to use a data block instead of an array literal. |
| 2 | Create the VineShapeFrame object. |
| 3 | Use setEndAngle to set a 90° angle. |
| 4 | Use GraphElement.setShapeFrame(frame) to add the VineShapeFrame to the PointElement. |
Script that modifies the graph or dataset properties should be placed on the Chart component itself. See Add Component Script for more information. This script has access to the Chart data and Chart API methods. Scripted Charts are not good candidates for user-modification, so you should deselect ‘Enable Ad Hoc Editing’ in the Chart Properties dialog box.
|