EGraph.setCoordinate(coord)
|
Sets the specified Coordinate for the Chart. See Chart Coordinates for available coordinate types. The corresponding “getter” function is EGraph.getCoordinate().
Paramater
- coord
-
A Coordinate object
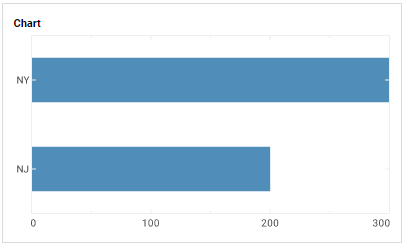
Example
Chart Component Script
dataset = [["State", "Quantity"], ["NJ", 200], ["NY", 300]];
graph = new EGraph();
var elem = new IntervalElement("State", "Quantity");
var sscale = new CategoricalScale("State");
var qscale = new LinearScale("Quantity");
var coord = new RectCoord(sscale,qscale); (1)
coord.transpose();
graph.setCoordinate(coord); (2)
graph.addElement(elem);| 1 | Create the Coordinate object. |
| 2 | Use setCoordinate to add the Coordinate object to the Chart. |
Script that modifies the graph or dataset properties should be placed on the Chart component itself. See Add Component Script for more information. This script has access to the Chart data and Chart API methods. Scripted Charts are not good candidates for user-modification, so you should deselect ‘Enable Ad Hoc Editing’ in the Chart Properties dialog box.
|