yAxis
Provides a shortcut to set axis properties for all Y-axes. The available properties are listed in Chart Axis Properties and Measure Axis Properties.
Example
Chart1.yAxis.minorIncrement = 1000;
Chart1.yAxis.labelColor = [255,0,0]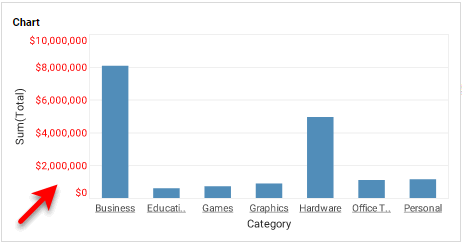
|
Either syntax below can be used in component script: For onInit/onRefresh scripts, and for component and property scripts on other components, the second (qualified) form is required. |
To set properties for a particular Y-axis (e.g., ‘Total’), use the axis property together with the axis name:
Chart1.axis['Sum(Total)'].minorIncrement = 1000;
Chart1.axis['Sum(Total)'].labelColor = [255,0,0];