DataSet.getData(column,row)
|
data for information on accessing pre-aggregate data. |
Returns the value in the dataset object specified by the column and row indices. The first column (index 0) contains the X-axis labels. For example, consider a chart with two datasets (measures), as shown below:
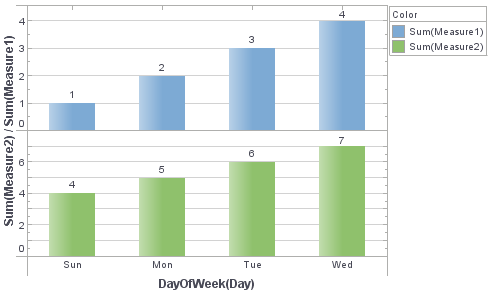
Use dataset.getData(j,i) with row index i and column index j to access these plotted values. The dataset.getRowCount() and dataset.getColCount() functions provide the number of rows and columns of summarized data.
Example
Chart Component Script
var str = "";
// Loop through rows
for (var i = 0; i < dataset.getRowCount(); i++) {
  str = "";
  // Loop through columns
  for (var j = 0; j < dataset.getColCount(); j++) {
    str += dataset.getData(j, i) + ",";
  }
  // Output the results
  alert(str);
}
The following output is displayed:
Sun May 31 00:00:00 EDT 2009, 1.0, 4.0,
Mon Jun 01 00:00:00 EDT 2009, 2.0, 5.0,
Tue Jun 02 00:00:00 EDT 2009, 3.0, 6.0,
Wed Jun 03 00:00:00 EDT 2009, 4.0, 7.0,
The values in the first column (e.g., Sun…2009, Mon…2009, etc.) are the dates on the X-axis, while the second and third columns represent the two datasets (Measure 1 and Measure 2).
Script that modifies the graph or dataset properties should be placed on the Chart component itself. See Add Component Script for more information. This script has access to the Chart data and Chart API methods. Scripted Charts are not good candidates for user-modification, so you should deselect ‘Enable Ad Hoc Editing’ in the Chart Properties dialog box.
|