LegendSpec.setVisible(Boolean)
Specifies whether the legend is visible. The corresponding “getter” function is getVisible().
Example
Chart Component Script
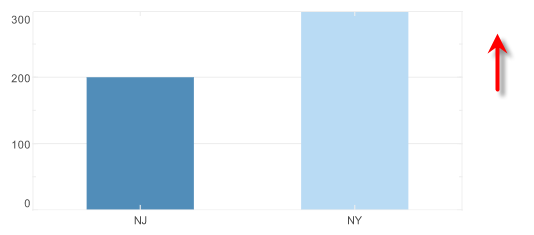
dataset = [["State", "Quantity"], ["NJ",200], ["NY",300]]; (1)
graph = new EGraph();
var elem = new IntervalElement("State", "Quantity");
var frame = new CategoricalColorFrame();
frame.setField("State");
var spec = new LegendSpec(); (2)
spec.setVisible(false); (3)
frame.setLegendSpec(spec); (4)
elem.setColorFrame(frame);
graph.addElement(elem);| 1 | See dataset to use a data block instead of an array literal. |
| 2 | Create the LegendSpec object. |
| 3 | Use setVisible to hide the legend. |
| 4 | Use VisualFrame.setLegendSpec(spec) to assign the LegendSpec to the ColorFrame. |
Script that modifies the graph or dataset properties should be placed on the Chart component itself. See Add Component Script for more information. This script has access to the Chart data and Chart API methods. Scripted Charts are not good candidates for user-modification, so you should deselect ‘Enable Ad Hoc Editing’ in the Chart Properties dialog box.
|
|
To change the property on a Chart that was previously created with the Chart Editor, use “getter” methods such as EGraph.getElement(index) ①, GraphElement.getColorFrame() ②, and VisualFrame.getLegendSpec() ③ to obtain a handle to the desired GraphElement, ColorFrame, and LegendSpec. For example: |