GraphElement.setInPlot(Boolean)
|
Specifies whether the chart should be resized so that graph elements remain fully visible in the chart area.
Parameter
- Boolean
-
true: resize chart (do not crop elements)
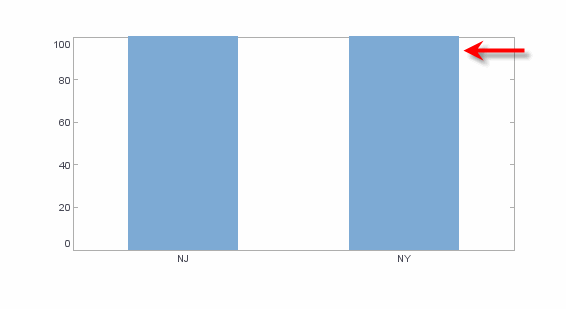
false: do not resize chart (crop elements)
Example
Chart Component Script
dataset = [["State", "Quantity"], ["NJ", 200], ["NY", 300]]; (1)
graph = new EGraph();
var elem = new IntervalElement("State", "Quantity"); (2)
var scale = new LinearScale("Quantity");
scale.setMax(100); (3)
graph.setScale("Quantity",scale);
elem.setInPlot(false); (4)
graph.addElement(elem); (5)| 1 | See dataset to use a data block instead of an array literal. |
| 2 | Create the IntervalElement object. |
| 3 | Use LinearScale.setMax(value) to set a fixed maximum for the ‘Quantity’ scale. |
| 4 | Use setInPlot to prevent resizing the plot area. |
| 5 | Use addElement to add the IntervalElement to the Chart. |
Script that modifies the graph or dataset properties should be placed on the Chart component itself. See Add Component Script for more information. This script has access to the Chart data and Chart API methods. Scripted Charts are not good candidates for user-modification, so you should deselect ‘Enable Ad Hoc Editing’ in the Chart Properties dialog box.
|
|
To change the property on a Chart that was previously created with the Chart Editor, use “getter” methods such as EGraph.getElement(index) ① to obtain a handle to the desired GraphElement object. For example: |