MultiTextFrame.setMessageFormat(str)
Specifies the formatting for the MultiTextFrame.
Parameter
- str
-
String using java.text.MessageFormat syntax, where
{0}represents the first field in theMultiTextFrame,{1}represents the second field in theMultiTextFrame, and so on. You can specify a format for each field using the patterns described in Add Data Format.
Example
Use MultiTextFrame to place multiple measures/dimensions as labels on a Chart. Follow the steps below:
-
Create the desired Chart.
-
If there are fields that you want to use as labels (that are not already on the ‘X’ or ‘Y’ axis or used in the Visual panel for ‘Color’, ‘Shape’, ‘Size’, or ‘Text’) add those fields in the ‘Break By’ region.
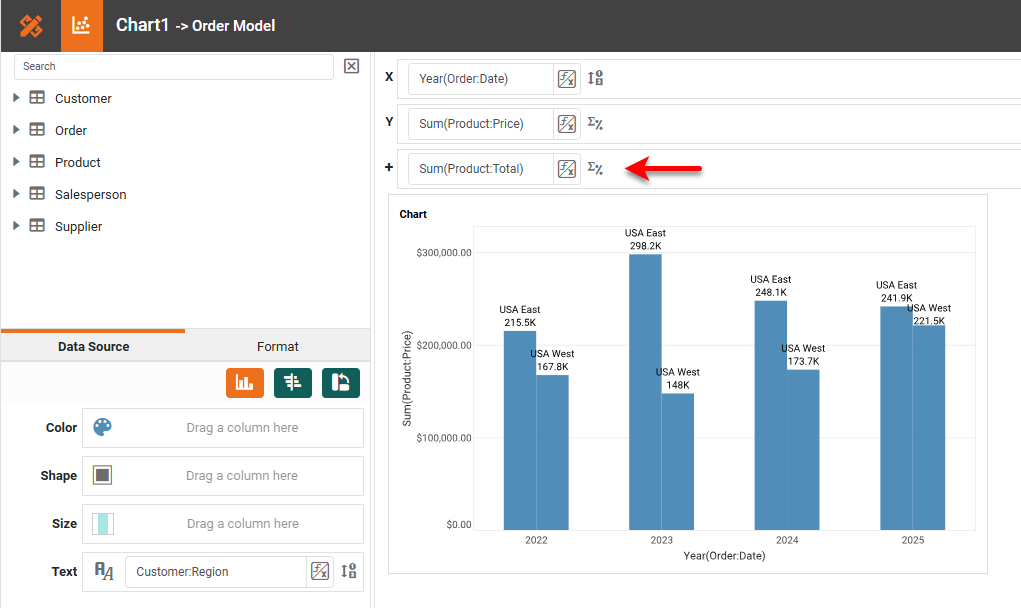
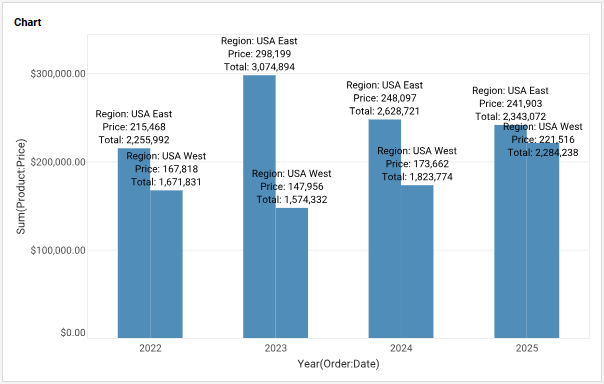
In the example below, ‘Order Date’ and ‘Price’ are displayed on the axes, and ‘Region’ is assigned as the ‘Text’ binding. Because we want a label for ‘Total’ as well, this field has been placed in the ‘Break By’ region.
-
Add the following script to the Chart component. (See Add Component Script.)
Chart Component Scriptvar tframe = new MultiTextFrame(); (1) tframe.setFields("Customer:Region", "Sum(Product:Price)", "Sum(Product:Total)"); (2) tframe.setMessageFormat(new java.text.MessageFormat("Region: {0}\nPrice: {1}\nTotal: {2}")); (3) graph.getElement(0).setTextFrame(tframe); (4)1 Create the MultiTextFrame object. 2 Use MultiTextFrame.setFields(arr) to assign the fields you want to use as labels. 3 Use setMessageFormat()to format the label text as desired.4 Use GraphElement.setTextFrame(frame) to add the MultiTextFrameto the IntervalElement. -
Press OK. The labels are displayed on the Chart.
-
Optional: Use the Format tab to change the label color to make them more visible. (See Add Visual Format.)
Script that modifies the graph or dataset properties should be placed on the Chart component itself. See Add Component Script for more information. This script has access to the Chart data and Chart API methods. Scripted Charts are not good candidates for user-modification, so you should deselect ‘Enable Ad Hoc Editing’ in the Chart Properties dialog box.
|