Profile a Dashboard
You can profile the execution of your Dashboards to determine which aspects of execution consume the most time. To do this, follow the steps below:
-
Press the ‘Setting’ button
 at the top of the Portal and select ‘Open with Profiling’
  .
.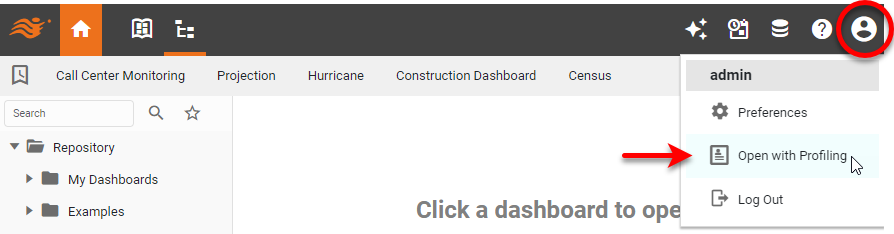
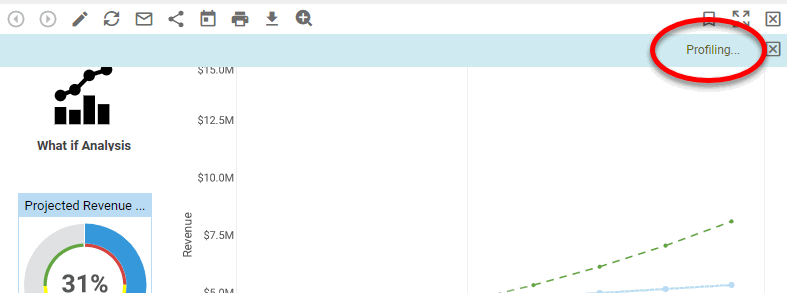
When this option is enabled, Dashboards will display a ‘Profiling…’ link below the toolbar.
-
Press the ‘Profiling…’ link to open the ‘Profile’ dialog box. This displays a break-down of execution time.
-
From the ‘
Group By’ menu, choose the way you want to break out the data: ‘Cycle Name’, ‘Dashboard’, ‘Logical Model’, ‘Data Worksheet’, or ‘Component’.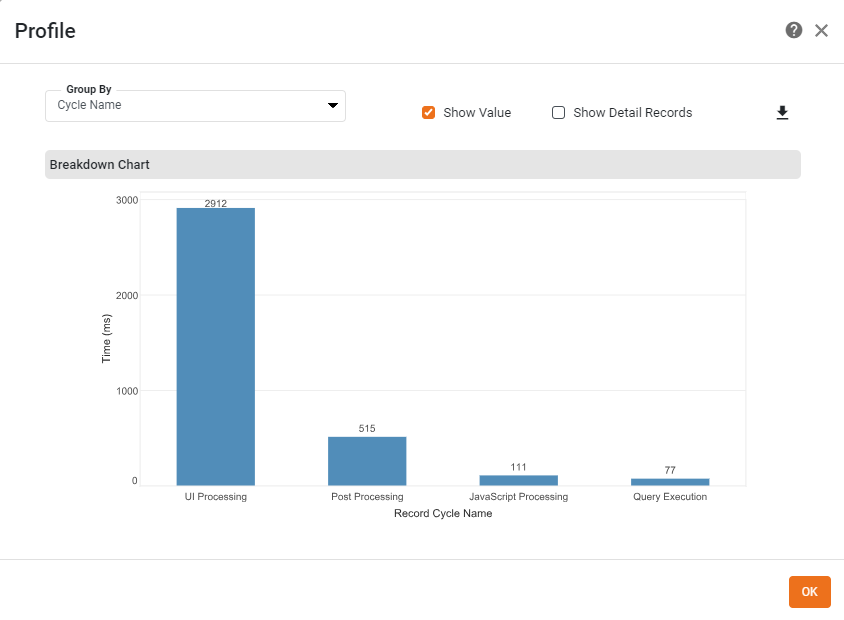
-
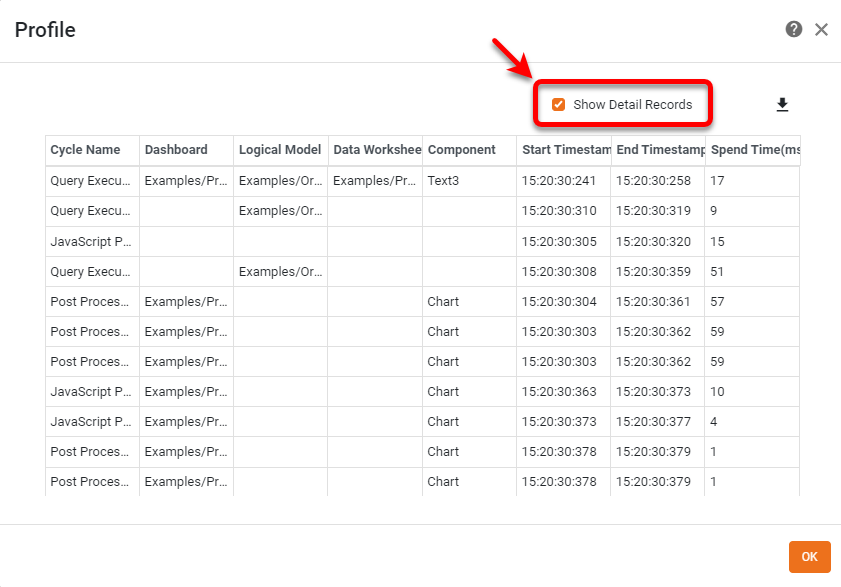
Enable ‘Show Detail Records’ link to view a tabular display of the execution information.
-
Optional: Press the ‘Export’ button
 to export the data.
 -
Press OK to dismiss the dialog box.