Use Charts
| These features are available to both designers and end-users. |
Charts provide many features for customization and exploration. These features are described in the sections below. After you modify a Chart, you can save your changes (if desired) in one of the following ways:
-
Save the entire Dashboard (if you have appropriate permissions). See Save a Public Dashboard.
-
Save the Chart as an Image. See Export a Chart as an Image in Export a Dashboard.
-
Save a new bookmark that contains the Chart modifications. See Bookmark a Dashboard.
-
Export the entire Dashboard. See Export a Dashboard.
Chart Toolbar
If the Chart mini-toolbar obscures Chart data, press the ‘Hide MiniToolbar’ button  to temporarily hide it. to temporarily hide it.
|
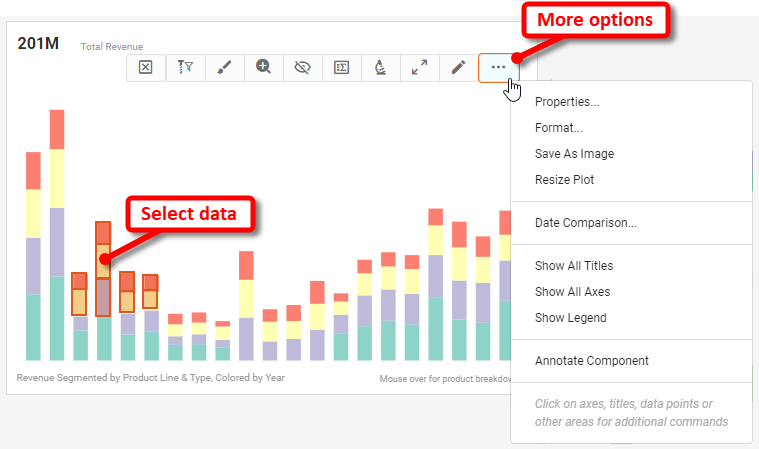
The mini-toolbar at the top of a Chart often provides a variety of tools for navigating and adapting the Chart. The table below lists the options that you might see in the toolbar. Some options are available only when you select data on the Chart.
|
How to select Chart data:
You can select contiguous or discontiguous data in a Chart:
|
- ‘Hide MiniToolbar’ button
-
Temporarily hide the Chart toolbar.
- ‘Drill Down Filter’ button

-
Drill and filter at the same time. See Drill Down and Filter in Drill Down into Data.
- ‘Brush Chart’ button

-
Highlight selected data across multiple Charts. See Brush a Chart in Drill Down into Data.
- ‘Zoom Chart’ button

-
Zoom into the selected Chart data. See Zoom a Chart in Drill Down into Data.
- ‘Exclude Data’ button

-
Zoom into the non-selected Chart data. See Zoom a Chart in Drill Down into Data.
- ‘Show Summary Data’ button

-
Display the Chart aggregates in tabular form. See Export Chart Data in Export a Dashboard.
- ‘Show Details’ button

-
Show the pre-aggregate detail data in tabular form. See Drill to Chart Detail Data in Drill Down into Data.
- ‘Show Enlarged’ button

-
Temporarily increase the size of the Chart to full screen.
- ‘Edit’ button

-
Open the Chart Editor. See Basic Charting Steps for information on how to use the Editor. This option may not be available for all Charts.
- ‘More’ button (
 ) > Properties
 -
Open the ‘Chart Properties’ dialog box. See Chart Properties. (Some options may not be available.)
- ‘More’ button () > Format
-
Opens the Format panel. See Add Visual Format. (Some options may not be available.)
- ‘More’ button () > Save As Image
-
Export the Chart as an image. See Export a Chart as Image in Export a Dashboard.
- ‘More’ button () > Resize Plot
-
Change the spacing of Chart data elements. See Basic Charting Steps.
- ‘More’ button () > Date Comparison
-
Perform a wide variety of date comparisons (e.g., last year vs. this year) on Chart data. See Compare Data by Date.
- ‘More’ button () > Show All Titles
-
Display any Chart titles that have been hidden.
- ‘More’ button () > Show All Axes
-
Display any Chart axes that have been hidden.
- ‘More’ button () > Show Legend
-
Display any hidden legends.
- ‘More’ button () > Annotate Component
-
Add annotations to the Chart. See Annotate a Dashboard.
Right-Click Options
You can right-click various areas of a Chart to get options specific to that region.
Axis Title
Right-click an axis title to view title-specific options such as the following:
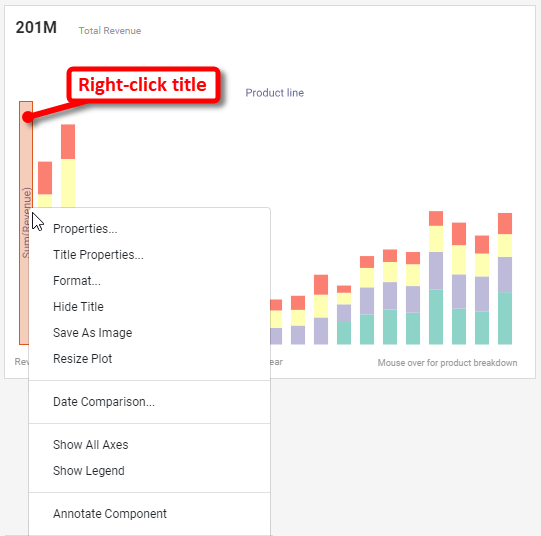
- Title Properties
-
Opens the ‘Title Properties’ dialog box. See Axis Title Properties.
- Format
-
Opens the Format panel for the title. See Add Visual Format and Add Data Format. (Some options may not be available.)
- Hide Title
-
Hide the title.
Axis
Right-click an axis to view axis-specific options such as the following:
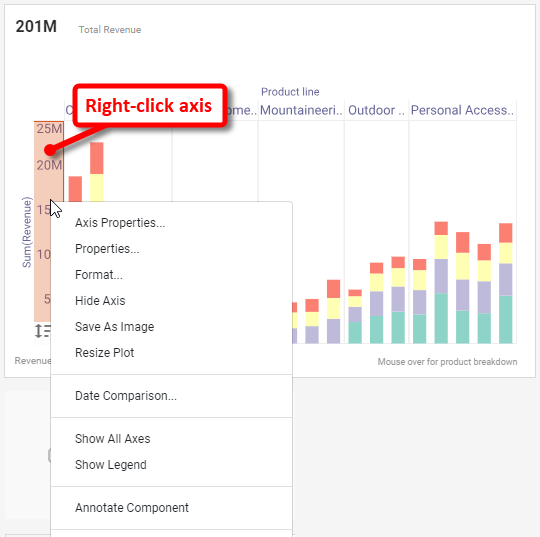
- Axis Properties
-
Opens the ‘Axis Properties’ dialog box for the axis. See Axis Properties.
- Format
-
Opens the Format panel for the axis. See Add Visual Format and Add Data Format. (Some options may not be available.)
- Hide Axis
-
Hide the axis.
Data Point
Right-click on Chart data to see the ‘Annotate Point’ option. See Annotate a Data Point in Annotate a Dashboard.
Legend
Right-click a legend to view legend-specific options such as the following:
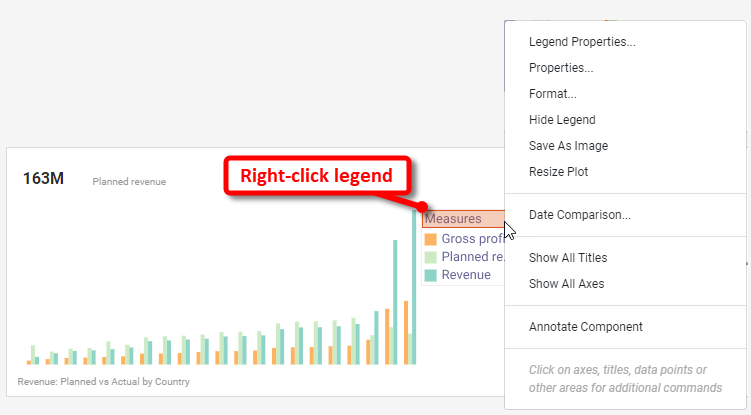
- Legend Properties
-
Opens the ‘Legend Properties’ dialog box for the axis. See Legend Properties.
- Format
-
Opens the Format panel for the legend. See Add Visual Format and Add Data Format. (Some options may not be available.)
- Hide Legend
-
Hide the legend.
Ad Hoc Editing
Press the ‘Edit’ button in the Chart mini-toolbar to open the Chart Editor. This provides extensive capabilities for modifying the Chart. See Basic Charting Steps for information on how to use the Editor.
|
This ‘Edit’ button may not be available for all Charts.
|