LegendSpec.setPartial(Boolean)
Set to true to specify that legend items should be accessible by scrolling if they do not fit in the allotted legend area. Set to false to force all legend items to be displayed without scrolling. (This may result in significant label truncation in some cases.)
Example
Create a Chart using the script below. Try dragging the Chart handles to make the Chart component narrower. Note how the legend becomes scrollable so that labels are not truncated.
Chart Component Script
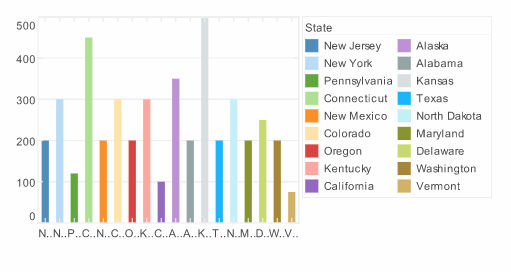
dataset = [["State", "Quantity"], ["New Jersey",200], ["New York",300], ["Pennsylvania",120],
["Connecticut",450], ["New Mexico",200],["Colorado",300], ["Oregon",200],
["Kentucky",300], ["California",100],  ["Alaska",350], ["Alabama",200],
["Kansas",500],  ["Texas",200], ["North Dakota",300], ["Maryland",200],
["Delaware",250],  ["Washington",200], ["Vermont",75]]; (1)

graph = new EGraph();
var elem = new IntervalElement("State", "Quantity");
var frame = new CategoricalColorFrame();
frame.setField("State");
var spec = new LegendSpec(); (2)
spec.setPartial(true); (3)
frame.setLegendSpec(spec); (4)
elem.setColorFrame(frame);
graph.addElement(elem);| 1 | See dataset to use a data block instead of an array literal. |
| 2 | Create the LegendSpec object. |
| 3 | Use setPartial() to enable scrollbars. |
| 4 | Use the inherited VisualFrame.setLegendSpec(spec) to assign the LegendSpec object to the ColorFrame. |
Script that modifies the graph or dataset properties should be placed on the Chart component itself. See Add Component Script for more information. This script has access to the Chart data and Chart API methods. Scripted Charts are not good candidates for user-modification, so you should deselect ‘Enable Ad Hoc Editing’ in the Chart Properties dialog box.
|
|
To change the property on a Chart that was previously created with the Chart Editor, use “getter” methods such as EGraph.getElement(index) ① and GraphElement.getColorFrame() ② to obtain a handle to the desired GraphElement and ColorFrame. For example: |