createIcicleGraph(colorDim, sizeCol, treeDims, [xdims, ydims])
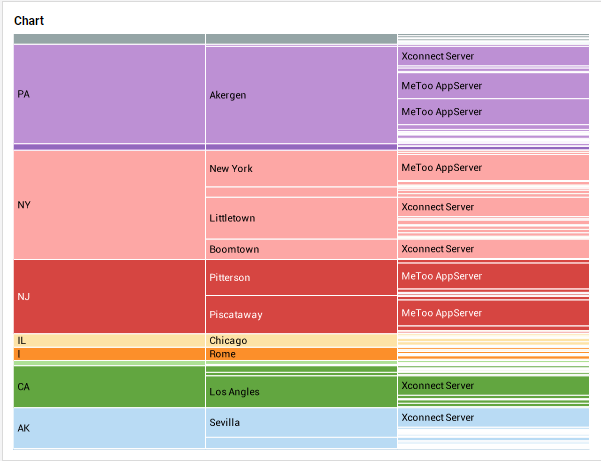
The createIcicleGraph() function generates an Icicle Chart.
Parameters
- colorDim
-
Name of dimension column whose values should be represented by color.
- sizeCol
-
Name of measure column whose values should determine the box size.
- treeDims
-
Array of dimension column names from which to construct the tree hierarchy.
- xdims
-
Array of dimensions (from among
colorDimandtreeDims) to be used to as the X-axis dimension. - ydims
-
Array of dimensions (from among
colorDimandtreeDims) to be used to as the Y-axis dimension.
Example
Chart Component Script
dataset = viewsheet['Query1']; (1)
graph = createIcicleGraph('state', "price", ["state", "city", "product_name"]) (2)| 1 | See dataset for more information about setting the dataset. |
| 2 | Create the icicle chart.
|
Script that modifies the graph or dataset properties should be placed on the Chart component itself. See Add Component Script for more information. This script has access to the Chart data and Chart API methods. Scripted Charts are not good candidates for user-modification, so you should deselect ‘Enable Ad Hoc Editing’ in the Chart Properties dialog box.
|