CALC.db(cost, salvage, life, period, [month])
Returns the depreciation of an asset for accounting year period using the fixed-declining balance method. This CALC function returns the same result as the Excel function of the similar name. The rate of depreciation is for a given year is
\$rate=(("months")/12)(1-(("salvage")/("cost"))^(1/"life"))\$
where months is the number of months in the year. For the first (fractional) year, months is given by parameter month. For subsequent full years, months is 12.
Depreciation during the final (fractional) period is the difference between the asset’s value in the previous period and the asset’s salvage value. The function returns 0 for periods after which the asset has already reached its salvage value.
Parameters
- cost
-
Initial cost of the asset
- salvage
-
Salvage value at end of asset life
- life
-
Number of years of depreciation
- period
-
Period (year index) for which to return depreciation (in range 1 to
life, inclusive) - month
-
Number of months in the first year of depreciation (default=12)
Example
Depreciation on a $1,000,000 asset that has a lifetime of 6 years, and end-of-life salvage value of $100,000, where the first year of depreciation contains 7 months.
var deprec = 0;
for(var period = 1; period < 7; period++) {
  deprec = CALC.db(1000000, 100000, 6, period, 7);
  alert('Period ' + period + ': Depreciation of ' + deprec);
}

// Returns:
// Period 1: Depreciation of 186083.33333333334
// Period 2: Depreciation of 259639.41666666666
// Period 3: Depreciation of 176814.44275000002
// Period 4: Depreciation of 120410.63551274998
// Period 5: Depreciation of 81999.64278418274
// Period 6: Depreciation of 55841.75673602846
To reference data when scripting a Data Worksheet Expression Column or Dashboard Calculated Field, use the field syntax. Example:
CALC.db(field['Cost'], field['Salvage'], 6, period, 7)To reference data in Dashboard global script, component script, or property script, use keywords such as value, selectedObjects, data, table, or parameter. Example:
CALC.db(RangeSlider1.selectedObjects[1], RangeSlider1.selectedObjects[0], 6, period, 7)
CALC.db(parameter.Cost, parameter.Salvage, 6, period, 7)
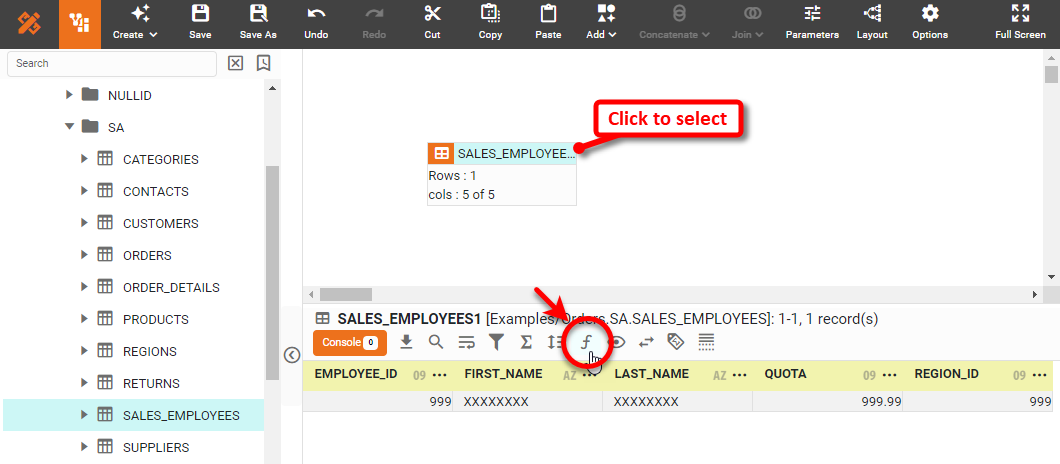
How to access data in Data Worksheet Expression Columns…To create an expression column in a Data Worksheet, press the ‘Create Expression’ button
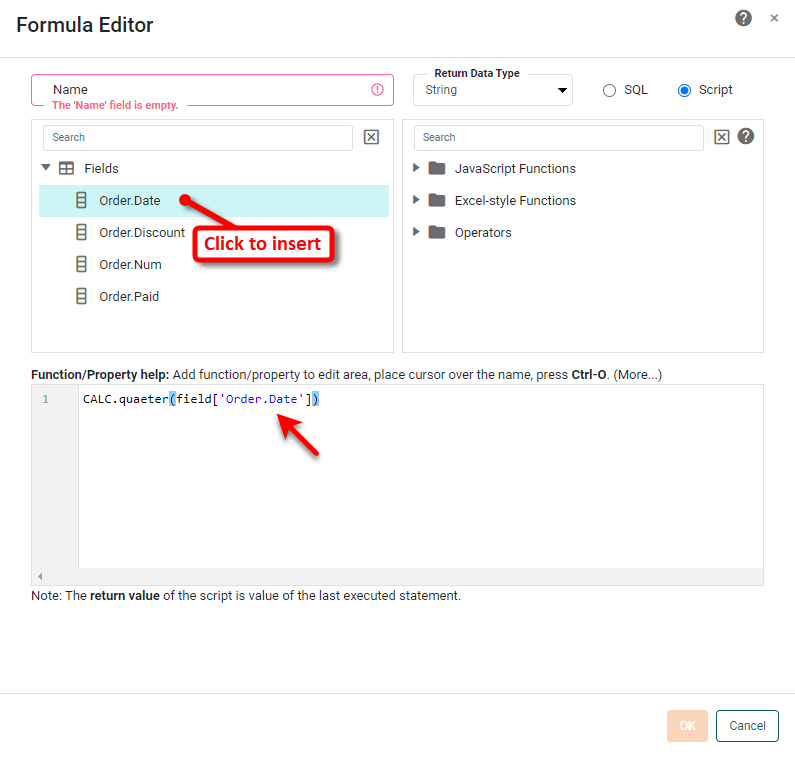
Insert fields (and parameters) into the script by clicking the items in the tree. Example syntax:
To reference the data contained in other cells of the data block, see the topics below: Example 1. Cell Referencing
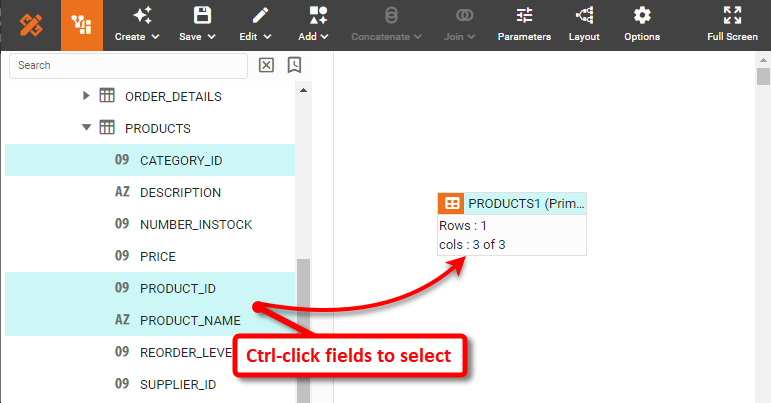
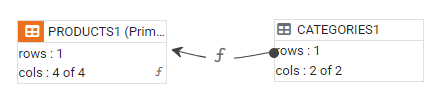
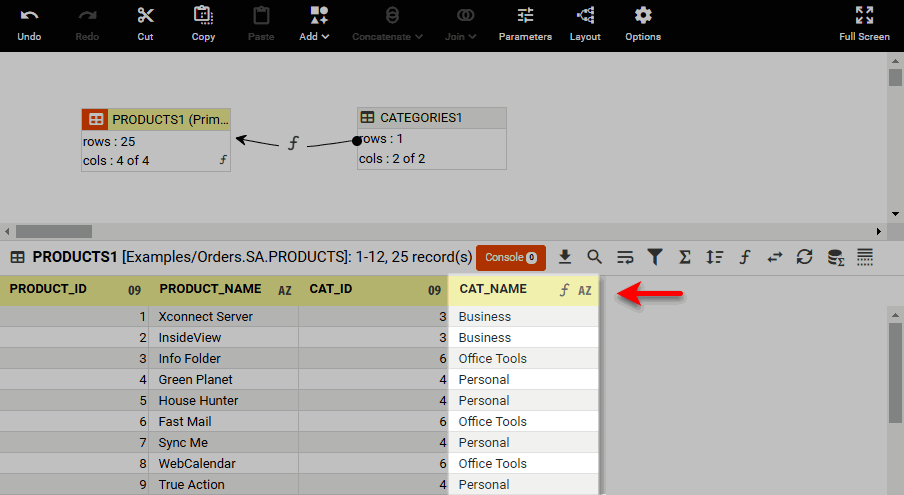
This example illustrates how you can reference the cells of another data block from within an Expression Column. You will use the tables in the folder of the ‘Orders’ data source to create a data block that has columns for product ID, product name, category ID, and category name.
Let’s say that you want to add a column to the ‘PRODUCTS1’ data block that will contain the category name corresponding to each entry in the ‘CAT_ID’ column. The best way to do this is to join the data blocks together (see Join Data), but to practice using cell references, in this case you will create this new column as an expression column. Follow the steps below:
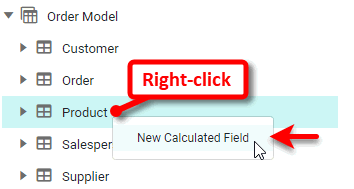
How to access data in Dashboard Calculated Fields…To create a calculated field in a dashboard, right-click on the data block, data model, or query to which you want to add the calculated field, and select ‘New Calculated Field’. (See Create a New Data Field for more details.)
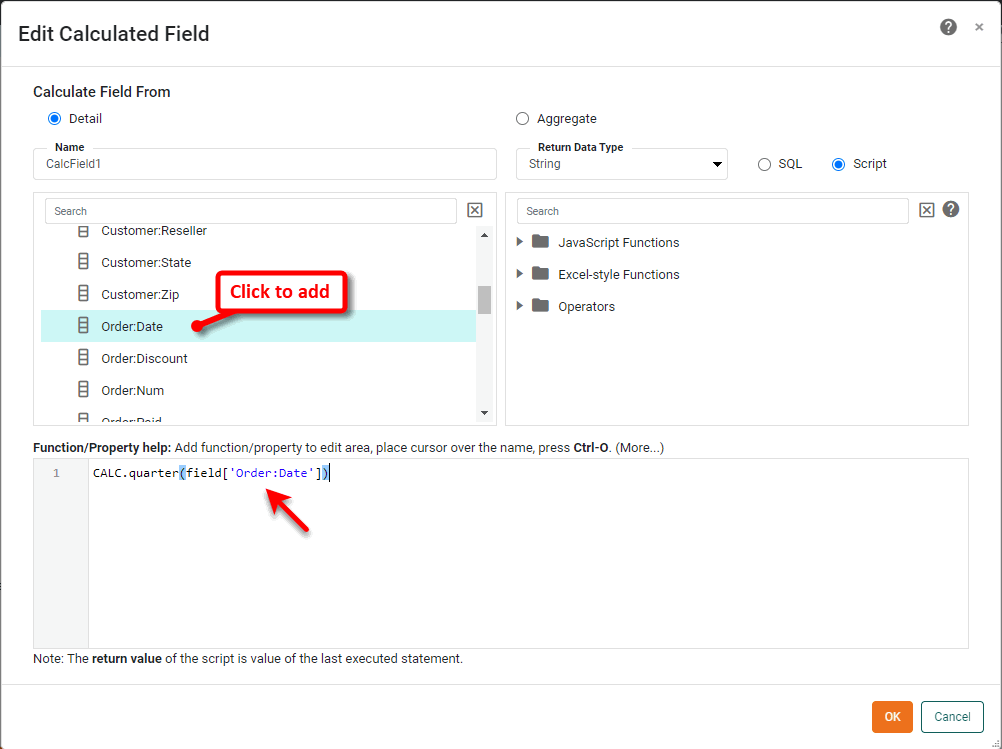
Insert fields (and parameters and component properties) into the script by clicking the items in the tree. Example syntax:
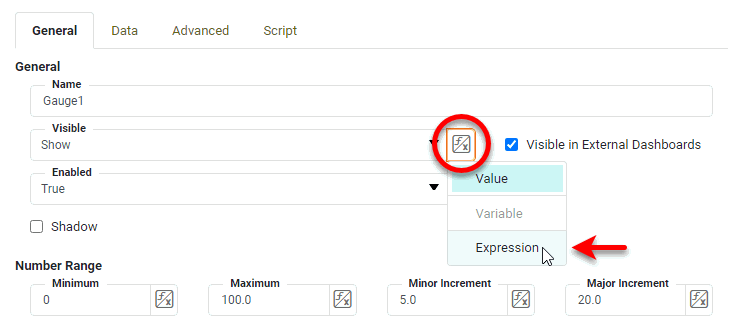
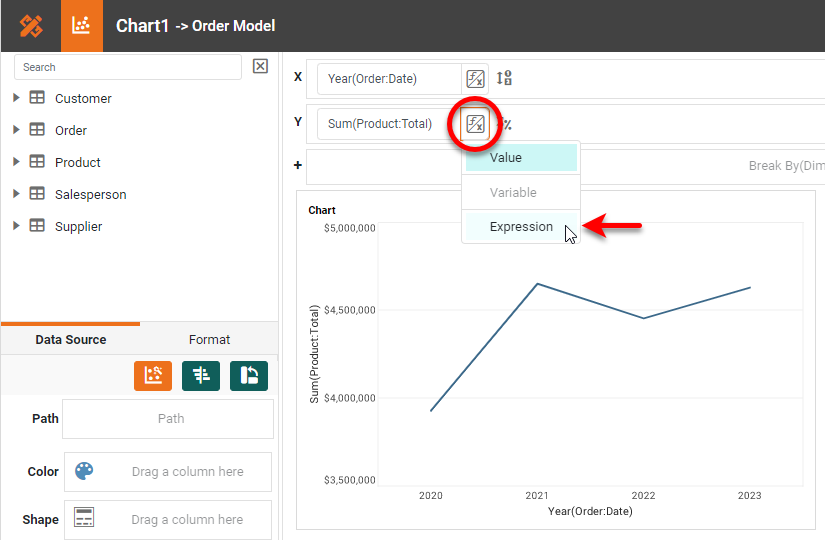
How to access data in Dashboard Property Expressions…To set a Dashboard property value using an expression, press the ‘Value Type’ button
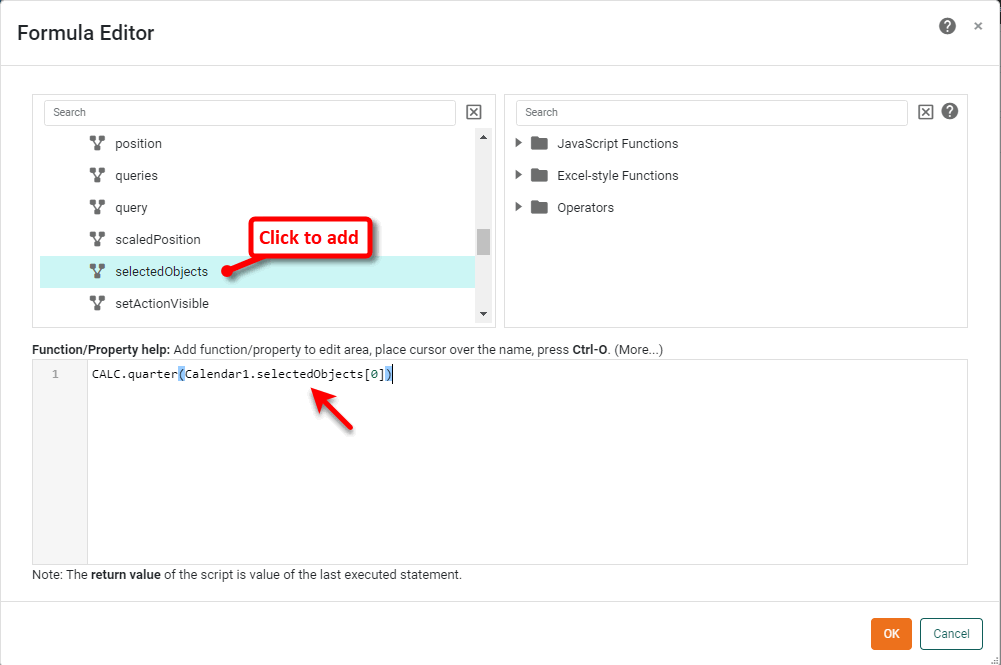
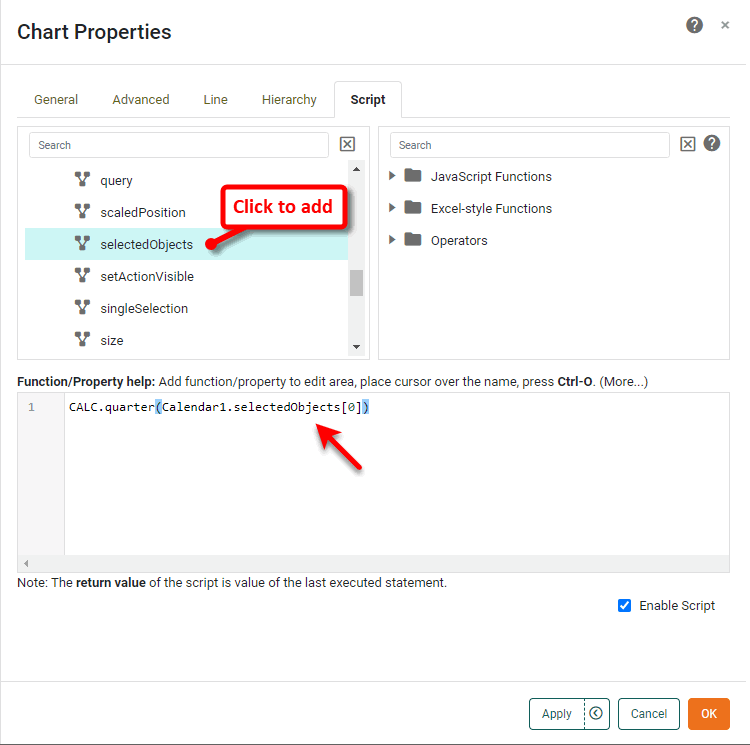
To insert a reference a component’s data, use the value, selectedObjects, data, or table property of the component. Example syntax:
See Dashboard Object Reference for information about accessing dashboard settings and data in script.
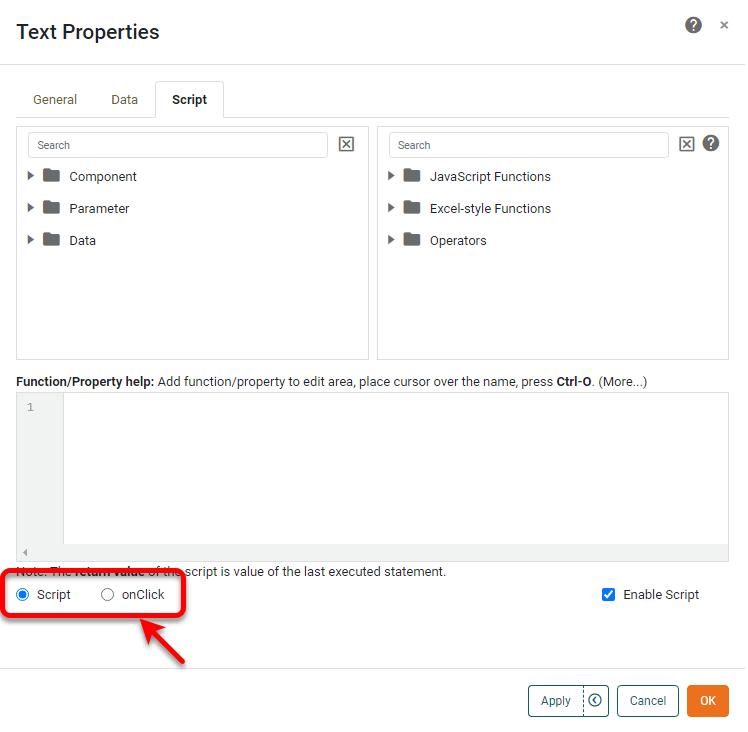
How to access data in Dashboard Scripts…To add script to a Dashboard component, right-click the desired component, and select ‘Properties’ from the context menu to open the ‘Properties’ panel. Note: You can also access menu options from the ‘More’ button (
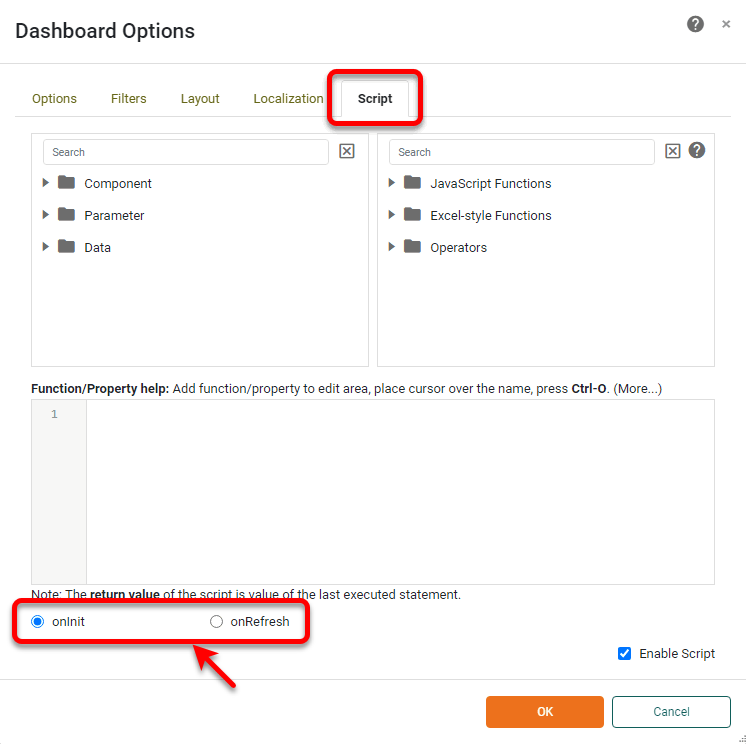
To add global script to a Dashboard, press ‘Options’ button
To insert a reference a component’s data, use the value, selectedObjects, data, or table property of the component. Example syntax:
See Dashboard Object Reference for information about accessing dashboard settings and data in script. |