Pivot Data
To create a desired chart or table in a Dashboard, you may sometimes need to “pivot” or “unpivot” the data in one of the following ways:
-
Convert multiple measures into a single measure by creating a new dimension. (The new dimension uses the measure labels as dimension values.)
-
Convert a single measure into multiple measures by using existing dimension values. (The new measures use the dimension values as the measure labels.)
Change Multiple Measures into a Single Measure
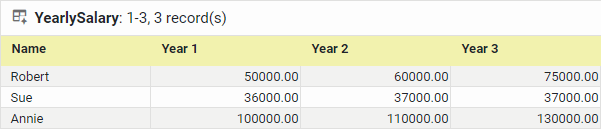
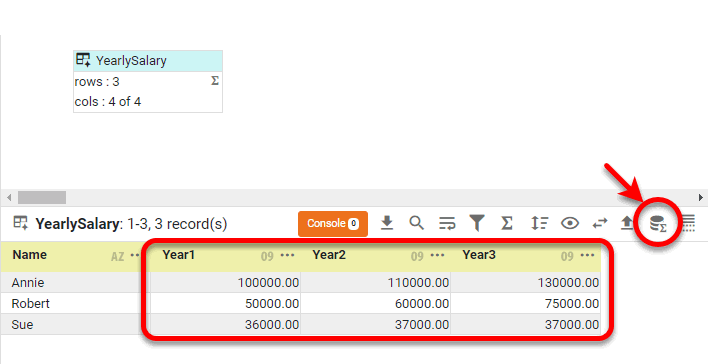
Consider the data block below, which contains one dimension (‘Name’) and three salary measures (‘Year 1’, ‘Year 2’, ‘Year 3’).
In certain cases you may want to convert multiple measures into a single measure by using the measure labels (‘Year 1’, ‘Year 2’, ‘Year 3’) as the values of a new dimension. To do this, follow the steps below:
-
Right click the data block thumbnail, and select ‘Unpivot’. Note: You can also access menu options from the ‘More’ button (
 ) in the mini-toolbar.
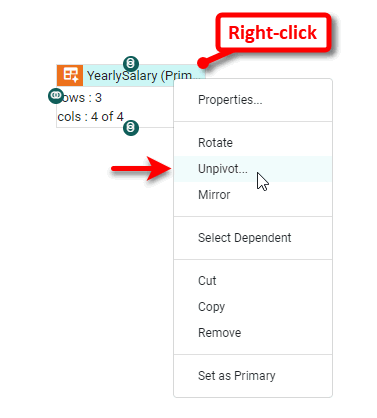
-
Enter a value for ‘Levels of Row Headers’. This is the number of columns (dimensions) to the left of the first measure in the data block. For the example above, there is just one column (‘Name’) to the left of the first measure.
To change the level of row headers at a later time, right-click the data block, and select ‘Edit Pivot Level’ from the context menu. 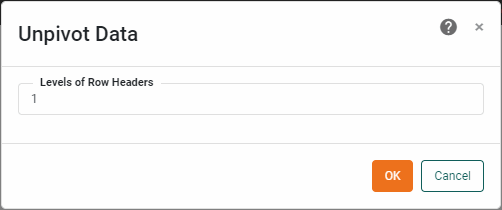
-
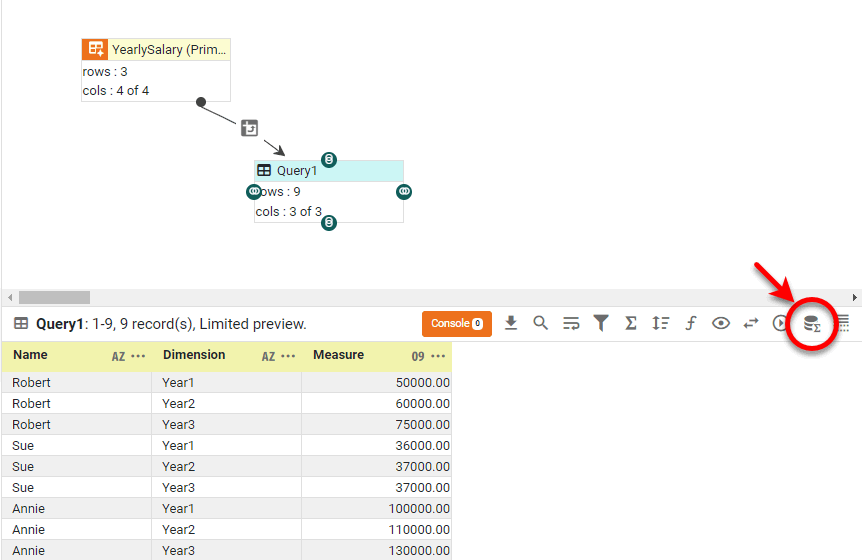
Press OK. This creates a new data block called ‘Query1’.
-
Preview the new data block (see Preview Data) to verify that the labels of the three measures have been used to create a new dimension, and the measure values have been combined into a single measure called ‘Measure’.
-
Change the column names as desired. (See Modify a Column for information on how to modify columns properties.)
Change a Single Measure into Multiple Measures
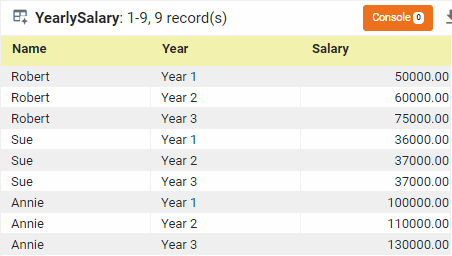
Consider the data block below, which contains two dimensions (‘Name’ and ‘Year’) and one measure (‘Salary’).
In certain cases you may want to convert a single measure into multiple measures by using the dimension values (‘Year 1’, ‘Year 2’, ‘Year 3’) as the labels of the new measures. You can do this by converting the table into a Crosstab. (See Group and Aggregate Data for full information about Crosstabs.)
Follow the steps below:
-
Click the data block thumbnail to select it, and press the ‘Group and Aggregate’ button
 the toolbar of the bottom panel.
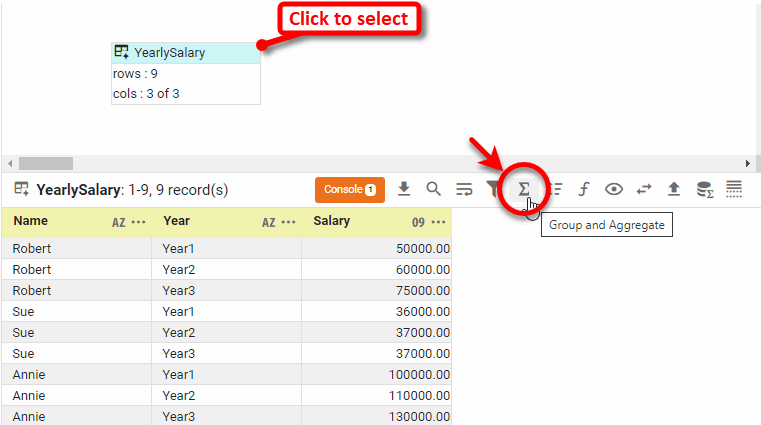
-
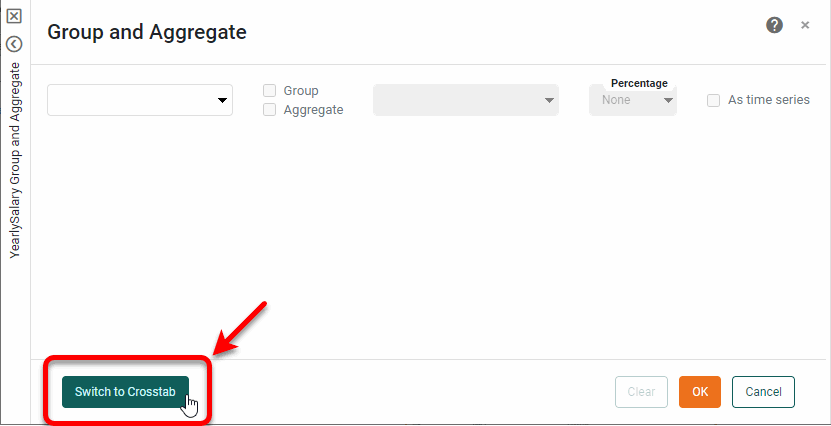
In the ‘Group and Aggregate’ panel, press Switch to Crosstab.
-
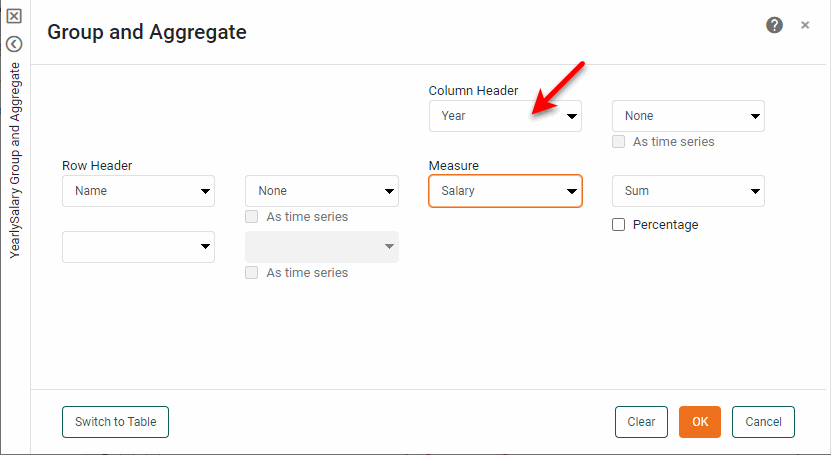
Select as the ‘Row Header’ the dimensions that you want to retain as dimensions. Select as ‘Column Header’ the dimension whose values you want to use as the new measure labels. Select as ‘Measure’ the measure that you want to convert into multiple measures.
-
Press OK.
-
Preview the data block (see Preview Data) to verify that the values of the ‘Year’ dimension have been used to create three new measures (‘Year 1’, ‘Year 2’, ‘Year 3’).
-
Change the column names as desired. (See Modify a Column for information on how to modify columns properties.)