ShapeForm.setTuple(value)
Specifies the location of the shape in logical space. The coordinates of the location are relative to the prevailing axis scaling. The corresponding “getter” function is getTuple().
Example
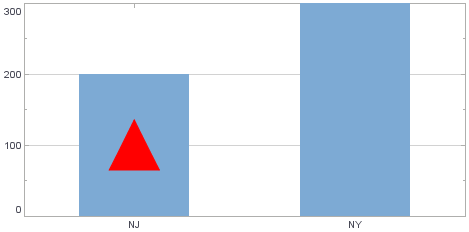
Chart Component Script
dataset = [["State", "Quantity"], ["NJ", 200], ["NY", 300]]; (1)
graph = new EGraph();
var elem = new IntervalElement("State", "Quantity");
var form = new ShapeForm(); (2)
form.setTuple([.5,100]); (3)
form.setShape(GShape.FILLED_TRIANGLE);
form.setColor(java.awt.Color(0xff0000));
form.setSize(new java.awt.Dimension(50,50));
graph.addForm(form); (4)
graph.addElement(elem);| 1 | See dataset to use a data block instead of an array literal. |
| 2 | Create the ShapeForm object. |
| 3 | Use setTuple() to set the axis location for the form. |
| 4 | Use EGraph.addForm(form) to add the GraphForm to the Chart. |
Script that modifies the graph or dataset properties should be placed on the Chart component itself. See Add Component Script for more information. This script has access to the Chart data and Chart API methods. Scripted Charts are not good candidates for user-modification, so you should deselect ‘Enable Ad Hoc Editing’ in the Chart Properties dialog box.
|