Scale.setSharedRange(Boolean)
For a FacetCoord, specifies whether the same scale range should be used across all sub-graphs in a facet, or whether a sub-graph’s scaling should be shared only with sub-graphs in the same row (for Y-axis scaling) or same column (for X-axis scaling).
Example
Chart Component Script
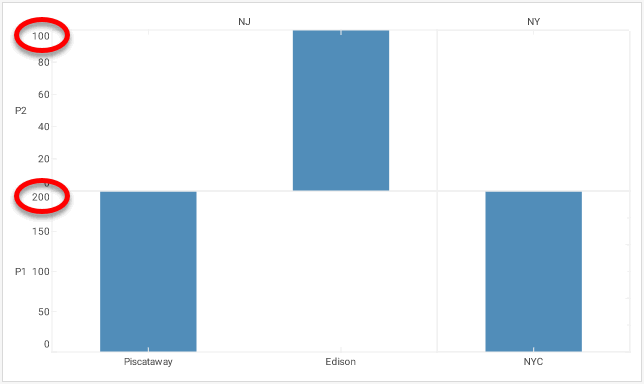
dataset = [["State", "City", "Product", "Quantity"],["NJ", "Piscataway", "P1", 200],
["NJ", "Edison", "P2", 100],["NY", "NYC", "P1", 300]]; (1)
graph = new EGraph();
var elem = new IntervalElement("City", "Quantity");
var state = new CategoricalScale("State");
var city = new CategoricalScale("City");
var product = new CategoricalScale("Product");
var quantity = new LinearScale("Quantity"); (2)
quantity.setSharedRange(false); (3)
var inner = new RectCoord(city, quantity); (4)
var outer = new RectCoord(state, product); (4)
var coord = new FacetCoord(outer,inner); (5)
graph.setCoordinate(coord); (6)
graph.addElement(elem);| 1 | See dataset to use a data block instead of an array literal. |
| 2 | Create the LinearScale object. |
| 3 | Use setSharedRange to share scaling by row and column. |
| 4 | Use the scales to create a new RectCoord object. |
| 5 | Create the FacetCoord object. |
| 6 | Use EGraph.setCoordinate(coord) to add the Coordinate to the Chart. |
Script that modifies the graph or dataset properties should be placed on the Chart component itself. See Add Component Script for more information. This script has access to the Chart data and Chart API methods. Scripted Charts are not good candidates for user-modification, so you should deselect ‘Enable Ad Hoc Editing’ in the Chart Properties dialog box.
|