bindingInfo.breakdownFields
Specifies the query fields on which to break down the data. These fields will be bound to the ‘Group By’ region of the Chart Editor.
Type
- 2D Array
-
[[Field1,Type1],[Field2,Type2],…]
Field: String
Type:Chart.STRING,Chart.DATE, orChart.NUMBER
Example
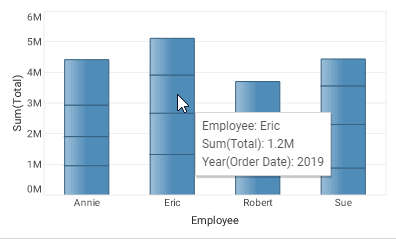
Chart1.query = "All Sales";
Chart1.bindingInfo.xFields = [["Employee",Chart.STRING]];
Chart1.bindingInfo.yFields = [["Total",Chart.NUMBER]];
Chart1.bindingInfo.breakdownFields = [["Order Date",Chart.DATE]];| The ‘All Sales’ Data Worksheet can be found in the folder. You may need to download the examples.zip file from GitHub into your environment. (This requires access to Enterprise Manager.) See Import and Export Assets for instructions on how to import. |
Dashboard script that modifies bindingInfo should generally be placed in the onRefresh handler. See Add Dashboard Script.
|