TriCoord.setScale(scale)
Specifies the scale to use for all three axes. This can also be specified as an argument to the constructor. The corresponding “getter” function is getScale().
Parameter
- scale
-
a Scale object
Example
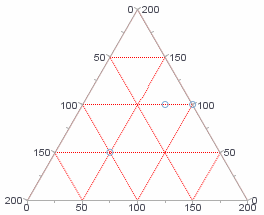
Chart Component Script
dataset = [["Quantity","Total","Returns"],[50,50,100],[75,100,25],[100,100,0]]; (1)
graph = new EGraph();
var elem = new PointElement();
var qscale = new LinearScale("Quantity"); (2)
qscale.setMin(0);
qscale.setMax(200);
var spec = new AxisSpec();
spec.setGridStyle(Chart.DOT_LINE);
spec.setGridColor(java.awt.Color.red);
qscale.setAxisSpec(spec);
var coord = new TriCoord(); (3)
coord.setScale(qscale); (4)
elem.addDim("Quantity"); (5)
elem.addDim("Total"); (6)
elem.addVar("Returns"); (7)
graph.addElement(elem);
graph.setScale("Quantity", qscale);
graph.setScale("Total", qscale);
graph.setScale("Returns", qscale);
graph.setCoordinate(coord); (8)| 1 | See dataset to use a data block instead of an array literal. |
| 2 | Create the Scale object. |
| 3 | Create the TriCoord object from the Scale object. |
| 4 | Use setScale to assign the Scale to the TriCoord. |
| 5 | Add first measure (‘Quantity’), represented on the bottom axis. |
| 6 | Add second measure (‘Total’), represented on the right axis. |
| 7 | Add third measure (‘Returns’), represented on the left axis. Note: The third measure must be added using GraphElement.addVar(field) rather than GraphElement.addDim(field). |
| 8 | Use EGraph.setCoordinate(coord) to add the RectCoord to the Chart. |
Script that modifies the graph or dataset properties should be placed on the Chart component itself. See Add Component Script for more information. This script has access to the Chart data and Chart API methods. Scripted Charts are not good candidates for user-modification, so you should deselect ‘Enable Ad Hoc Editing’ in the Chart Properties dialog box.
|