SizeFrame.setLargest(value)
Specifies the highest value in the range. For PointElement and LineElement, this is the size (in pixels) at which the largest value in the bound column is displayed. Smaller values are scaled according to the mapping defined by the object’s scaling method (e.g., linear for LinearSizeFrame, etc.). For SchemaElement and IntervalElement graphs, the value specified for the largest property is relative to the SizeFrame.setMax(value) value.
For example, if largest=50 and max=100, the largest value in the bound column is displayed at one half of the maximum allowable size. The value of largest should be less than the value of max. You can also set this using the bindingInfo.sizeFrame.largest property syntax in onRefresh script. See Example 2 below. The corresponding “getter” function is getLargest().
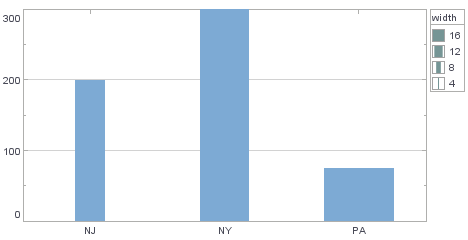
Example 1
dataset = [["State", "Quantity", "width"], ["NJ", 200, 5],["NY", 300,10], ["PA",75,15]]; (1)
graph = new EGraph();
var elem = new IntervalElement("State", "Quantity");
var frame = new LinearSizeFrame(); (2)
frame.setField("width"); (3)
frame.setSmallest(10);
frame.setLargest(50); (4)
frame.setMax(100);
elem.setSizeFrame(frame); (5)
graph.addElement(elem);| 1 | See dataset to use a data block instead of an array literal. |
| 2 | Create the LinearSizeFrame object. |
| 3 | Use VisualFrame.setField(field) to assign the desired measure to the LinearSizeFrame. |
| 4 | Use setLargest to display the largest value at 50 pixels. |
| 5 | Use GraphElement.setSizeFrame(frame) to add the LinearSizeFrame to the IntervalElement. |
Script that modifies the graph or dataset properties should be placed on the Chart component itself. See Add Component Script for more information. This script has access to the Chart data and Chart API methods. Scripted Charts are not good candidates for user-modification, so you should deselect ‘Enable Ad Hoc Editing’ in the Chart Properties dialog box.
|
|
To change the property on a Chart that was previously created with the Chart Editor, use “getter” methods such as EGraph.getElement(index) ① and GraphElement.getSizeFrame() ② to obtain a handle to the desired GraphElement and SizeFrame. For example: |
Example 2
This example illustrates how to use bindingInfo properties to control the SizeFrame.
-
Bind a Point Chart to the sample ‘All Sales’ Data Worksheet, with ‘Company’ (top 5) on the X-axis, and Sum(Total) on the Y-axis.
The ‘All Sales’ Data Worksheet can be found in the folder. You may need to download the examples.zip file from GitHub into your environment. (This requires access to Enterprise Manager.) See Import and Export Assets for instructions on how to import. -
Add the following script in the onRefresh handler. (See Add Dashboard Script.)
onRefresh ScriptChart1.bindingInfo.setSizeField("Total",Chart.NUMBER); Chart1.bindingInfo.sizeFrame = new LinearSizeFrame; Chart1.bindingInfo.sizeFrame.smallest = 10; Chart1.bindingInfo.sizeFrame.largest = 50; Chart1.bindingInfo.sizeFrame.max = 100;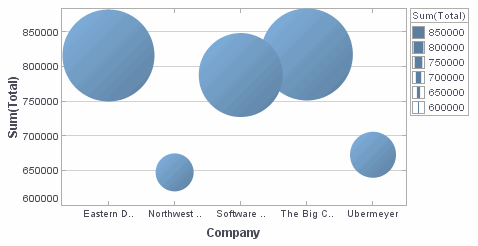
Dashboard script that modifies bindingInfoshould generally be placed in the onRefresh handler. See Add Dashboard Script.