TagForm
Example
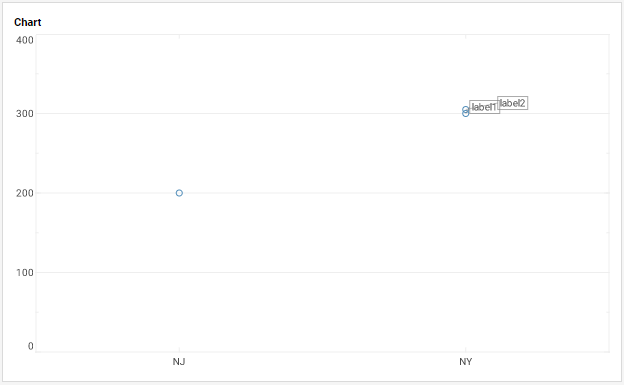
Chart Component Script
dataset = [["State","Quantity"],["NJ",200],["NY",300],["NY",305]]; (1)
graph = new EGraph();
var elem = new PointElement("State", "Quantity");
var form1 = new TagForm(); (2)
var form2 = new TagForm(); (2)
form1.setLabel("label1"); (3)
form1.setValues(['NY', 300]); (4)
form2.setLabel("label2"); (3)
form2.setValues(['NY', 305]); (4)
graph.addForm(form1); (5)
graph.addForm(form2); (5)
graph.addElement(elem);| 1 | See dataset to use a data block instead of an array literal. |
| 2 | Create the TagForm object. |
| 3 | Use inherited LabelForm.setLabel(value) function to set label text. |
| 4 | Use inherited LabelForm.setValues(value) function to set label position. |
| 5 | Use EGraph.addForm(form) to add the GraphForm to the Chart. |
Script that modifies the graph or dataset properties should be placed on the Chart component itself. See Add Component Script for more information. This script has access to the Chart data and Chart API methods. Scripted Charts are not good candidates for user-modification, so you should deselect ‘Enable Ad Hoc Editing’ in the Chart Properties dialog box.
|