TimeScale.setIncrement(value)
Example
Chart Component Script
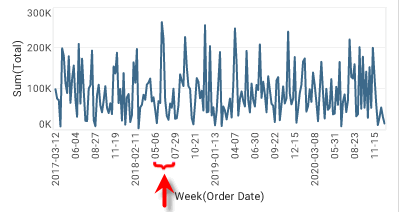
graph.getScale("Order Date").setIncrement(12) (1)| 1 | Set increment to 12 weeks. |
Script that modifies the graph or dataset properties should be placed on the Chart component itself. See Add Component Script for more information. This script has access to the Chart data and Chart API methods. Scripted Charts are not good candidates for user-modification, so you should deselect ‘Enable Ad Hoc Editing’ in the Chart Properties dialog box.
|