Concatenate Data
Concatenations allow you to mash up data from different data blocks, which may represent different database tables, queries, or data models. A concatenated data block is a vertical composition of two or more data blocks with a specified relationship (union, intersection, difference) between the rows of the base data blocks.
| To create a horizontal composition of two or more data blocks, see Join Data. |
To create a union, intersection, or difference (minus) between two data blocks, follow these steps:
-
Create the data block you want to join. See Create a Data Worksheet for information on how to create a data block.
-
Select the data blocks you want to concatenate. (You can hold the Ctrl or Shift key and click on the data blocks to select both, or drag with the mouse to “lasso” the data blocks.)
Data blocks must have the same number of columns in order to participate in concatenations, and the corresponding columns of each data block must have the same data type. If you plan to create a difference (minus), the order in which you select the data blocks is important. If you seek the difference C=A-B, where the result C should contain the rows that are present in A but not present in B, first select data block A and then select data block B. -
Press the ‘Concatenate’ button
 in the toolbar and select the desired concatenation.
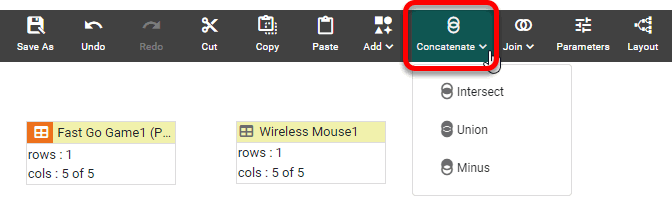
-
‘Intersect’
 : See Create an Intersection for an example.
 -
‘Union’
 : See Create a Union for an example.
 -
‘Minus’
 : See Create a Minus (Difference) for an example.
-
You can now use this Data Worksheet to supply the dataset for a Dashboard. See Visualize Your Data to create a Dashboard.
Create an Intersection
The intersection of two data blocks contains the unique set of common rows shared by the two data blocks, ordered lexicographically. Only a single instance of each shared row is retained in the intersection table; all duplicates are removed.
Assume that you want a list of only those customers who have purchased more than 100 pieces of both ‘Wireless Mouse’ and ‘Fast Go Game’. This can be accomplished by taking the intersection of the ‘Wireless Mouse’ and ‘Fast Go Game’ Data Worksheets.
-
Create a new Data Worksheet. For information on how to create a new Data Worksheet, see Create a Data Worksheet.
-
From the left Asset panel, Drag the ‘Wireless Mouse’ Data Worksheet into the right panel. This creates a new data block named ‘Wireless Mouse1’.
The ‘Fast Go Game’ and ‘Wireless Mouse’ Data Worksheets can be found in the folder. You may need to download the examples.zip file from GitHub into your environment. (This requires access to Enterprise Manager.) See Import and Export Assets for instructions on how to import. -
From the left Asset panel, drag the ‘Fast Go Game’ Data Worksheet into the right panel. This creates a new data block named ‘Fast Go Game1’.
-
Drag across both data blocks to select them. Press the ‘Concatenate’ button
in the toolbar and select ‘Intersect’ .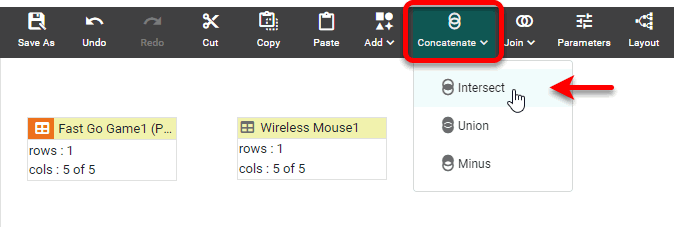
This creates a new data block, ‘Query1’.
-
Click the ‘Query1’ data block to select it. In the bottom panel, press the ‘Change View’ button
 and choose ‘Live Data View’
  .
.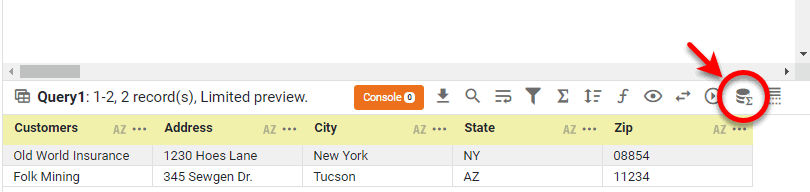
Only those customers who purchased more than 100 pieces of both ‘Wireless Mouse’ and ‘Fast Go Game’ are included in the result set.
Create a Union
Watch Video: Create a Union
This video might show an earlier version of the feature or operation that differs in minor ways from the current version.
By default, the union of two data blocks contains all the unique rows from the two data blocks. The first data blocks you select is the data block whose distinct rows will appear first in the result. By default, no duplicate rows are retained in the union data blocks. To retain duplicates, see Change the Concatenation Type.
Consider a data block that returns a list of customers who have purchased more than 100 pieces of ‘Wireless Mouse’ and a second data block returns a list of customers who have purchased more than 100 pieces of ‘Fast Go Game’. To see the contact information of all these customers in a single data block, perform a union.
Follow the steps below:
-
Create a new Data Worksheet. For information on how to create a new Data Worksheet, see Create a Data Worksheet.
-
From the left Asset panel, Drag the ‘Wireless Mouse’ Data Worksheet into the right panel. This creates a new data block named ‘Wireless Mouse1’.
The ‘Fast Go Game’ and ‘Wireless Mouse’ Data Worksheets can be found in the folder. You may need to download the examples.zip file from GitHub into your environment. (This requires access to Enterprise Manager.) See Import and Export Assets for instructions on how to import. -
From the left Asset panel, drag the ‘Fast Go Game’ Data Worksheet into the right panel. This creates a new data block named ‘Fast Go Game1’.
-
Drag across both data blocks to select them. Press the ‘Concatenate’ button
in the toolbar and select ‘Union’ .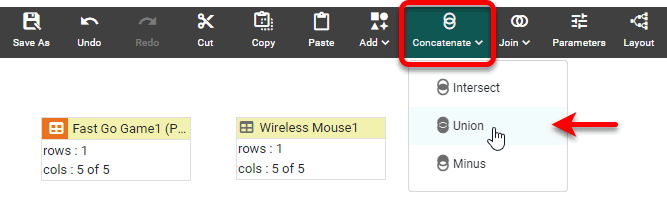
This creates a new data block, ‘Query1’.
-
Click the ‘Query1’ data block to select it. In the bottom panel, press the ‘Change View’ button
and choose ‘Live Data View’ .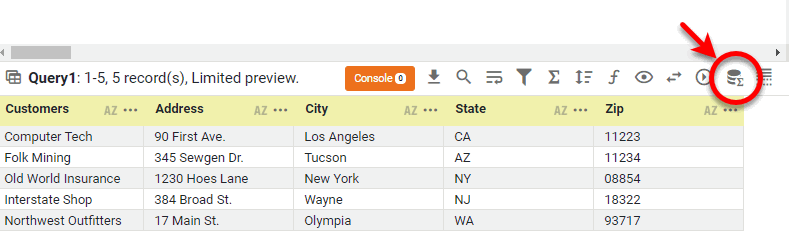
The data block returns all customers who purchased more than 100 pieces of either ‘Wireless Mouse’ or ‘Fast Go Game’.
Create a Minus (Difference)
The difference (minus) of two data blocks is the set of distinct rows found in one data block but not in the other. The first data block that you select is the data block whose unique rows are retained in the result.
Assume you want a list of all the customers who purchased more than 100 pieces of ‘Fast Go Game’ but did not purchase more than 100 pieces of ‘Wireless Mouse’. Follow these steps to obtain that result.
-
Create a new Data Worksheet. For information on how to create a new Data Worksheet, see Create a Data Worksheet.
-
From the left Asset panel, Drag the ‘Wireless Mouse’ Data Worksheet into the right panel. This creates a new data block named ‘Wireless Mouse1’.
The ‘Fast Go Game’ and ‘Wireless Mouse’ Data Worksheets can be found in the folder. You may need to download the examples.zip file from GitHub into your environment. (This requires access to Enterprise Manager.) See Import and Export Assets for instructions on how to import. -
From the left Asset panel, drag the ‘Fast Go Game’ Data Worksheet into the right panel. This creates a new data block named ‘Fast Go Game1’.
-
First click the ‘Fast Go Game1’ data block to select it.
-
Now click the ‘Wireless Mouse1’ data block to select it.
It is important to select the ‘Wireless Mouse1’ data block after you select the ‘Fast Go Game1’ data block. -
Press the ‘Concatenate’ button
in the toolbar and select ‘Minus’ . This creates a new data block, ‘Query1’.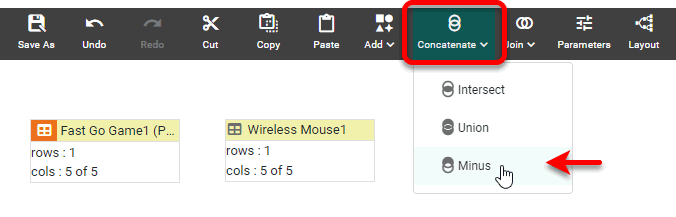
-
Click the ‘Query1’ data block to select it. In the bottom panel, press the ‘Change View’ button
and choose ‘Live Data View’ .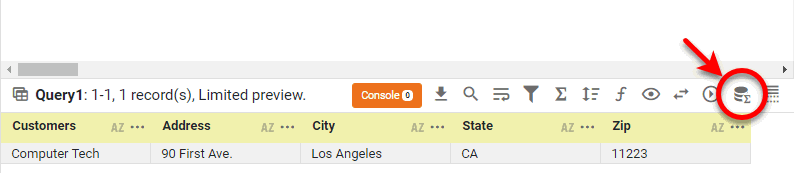
The data block returns all customers who purchased more than 100 pieces of ‘Fast Go Game’ but did not purchase more than 100 pieces of ‘Wireless Mouse’. (In this example, there is only one such customer).
Change the Concatenation Type
To change the concatenation type of concatenated data block (intersection, union, minus), follow these steps:
Watch Video: Change Concatenation
This video might show an earlier version of the feature or operation that differs in minor ways from the current version.
-
Right-click on the Concatenated Table and select ‘Edit Concatenation’ from the context menu. Note: You can also access menu options from the ‘More’ button (
 ) in the mini-toolbar.
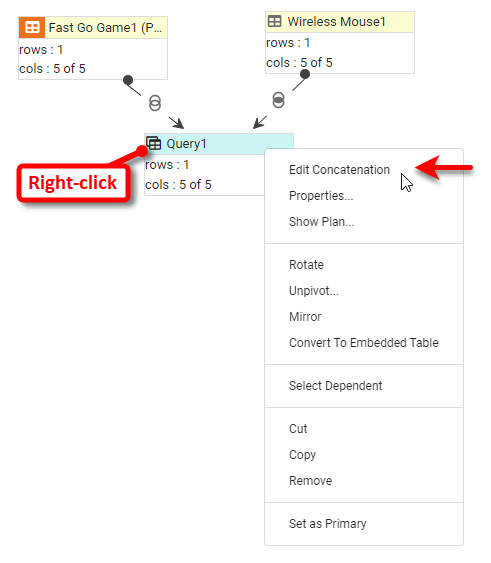
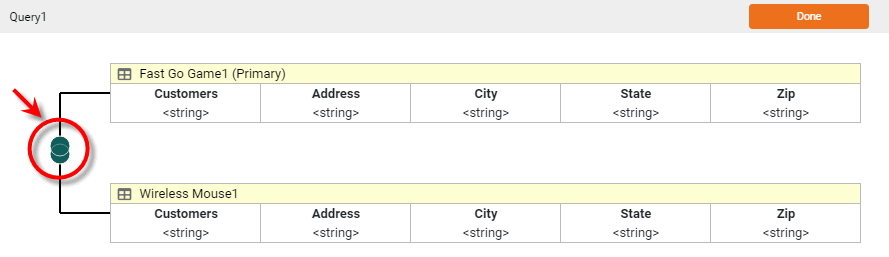
This opens the Concatenation Editor.
-
Press the ‘Edit Concatenation’ button on the left side of the diagram corresponding to the concatenation you want to change. This opens the ‘Concatenation Type’ panel.
-
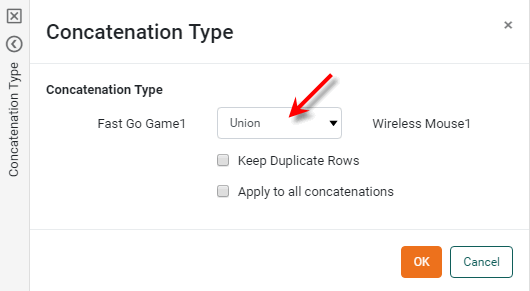
Select a new concatenation type.
-
If you set the concatenation type to ‘Union’, you can choose ‘Keep Duplicate Rows’ to prevent the removal of duplicate rows from the result.
-
Optional: If the concatenated data block contains multiple concatenations, select ‘Apply to all concatenations’ to simultaneously update all of the links to the specified concatenation type. Leave this option disabled to modify only the selected link.
-
Press Done to close the Editor.
You can now use this Data Worksheet to supply the dataset for a Dashboard. See Visualize Your Data to create a Dashboard.
Change Concatenation Order
To change the order in which the tables are concatenated (which would affect the result in the case of a Minus operation), follow the steps below:
-
Open the Concatenation Editor as described in Change the Concatenation Type above.
-
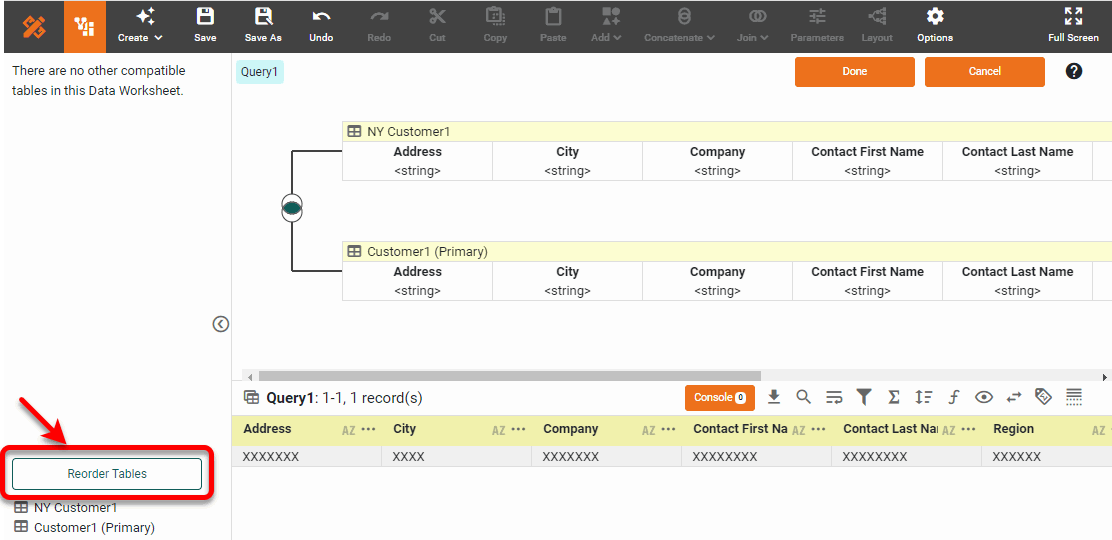
Press the Reorder Tables button at the bottom of the left panel. This opens the ‘Reorder Tables’ dialog box.
-
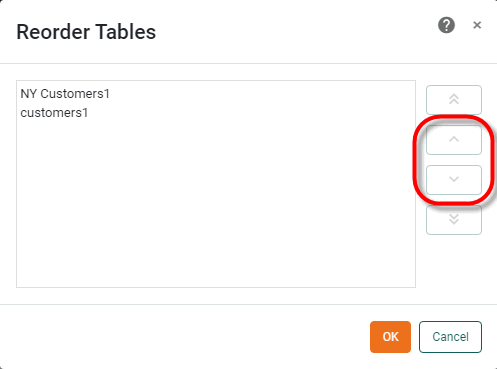
In the ‘Reorder Tables’ dialog box, click a table in the list and set the desired position for the table by using the arrow buttons. Then press OK.
-
Press Done to close the Editor.
You can now use this Data Worksheet to supply the dataset for a Dashboard. See Visualize Your Data to create a Dashboard.
Add Tables to a Concatenation
To add additional tables into a existing concatenation, follow these steps:
-
Right-click on the Concatenated Table and select ‘Edit Concatenation’ from the context menu. Note: You can also access menu options from the ‘More’ button (
) in the mini-toolbar. -
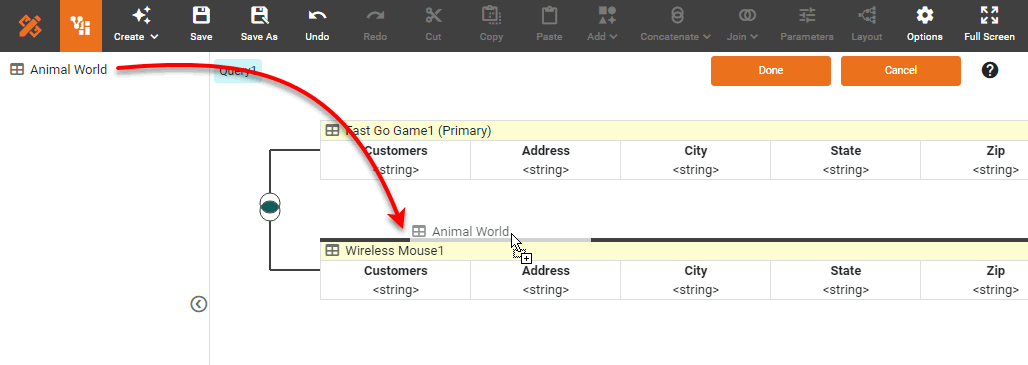
In the Concatenation Editor, drag any additional tables from the left panel onto the border of the table where the concatenation should be made. (A green highlight indicates the concatenation position.)
-
Press Done to close the Editor.
You can now use this Data Worksheet to supply the dataset for a Dashboard. See Visualize Your Data to create a Dashboard.