RectForm.setBottomRightValues(value)
Specifies the point in logical space for the bottom right corner of the rectangle. The coordinates of the point are relative to prevailing axis scaling prior to transformation. So, for a categorical X-axis (e.g., ‘NJ’, ‘NY’, ‘PA’, etc.), the X-value of setBottomRightValues() should specify a categorical value (e.g., ‘NJ’). The corresponding “getter” function is getBottomRightValues().
Example
Chart Component Script
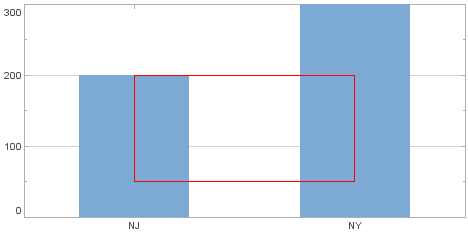
 dataset = [["State", "Quantity"], ["NJ", 200], ["NY", 300]]; (1)
graph = new EGraph();
var rect = new RectForm(); (2)
rect.setTopLeftValues(['NJ',200]);
rect.setBottomRightValues(['NY',50]); (3)
rect.setColor(java.awt.Color(0xff0000));
graph.addForm(rect); (4)
graph.addElement(new IntervalElement("State", "Quantity"));| 1 | See dataset to use a data block instead of an array literal. |
| 2 | Create the RectForm object. |
| 3 | Use setBottomRightValues() to set the bottom-right corner. |
| 4 | Use EGraph.addForm(form) to add the GraphForm to the Chart. |
Script that modifies the graph or dataset properties should be placed on the Chart component itself. See Add Component Script for more information. This script has access to the Chart data and Chart API methods. Scripted Charts are not good candidates for user-modification, so you should deselect ‘Enable Ad Hoc Editing’ in the Chart Properties dialog box.
|
|
To change the property on a Chart that was previously created with the Chart Editor, you do not need to add a Chart element. For example: |