LineElement.setIgnoreNull(Boolean)
Specifies whether null values should be ignored in order to prevent a gap in the line. Note: There is no corresponding “getter” function.
Parameters
- Boolean
-
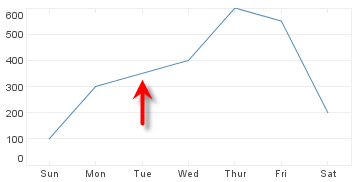
true: ignore nulls and draw a continuous line
false: honor nulls and break line where a null value occurs
Example
Chart Component Script: Break Line at Null
dataset = [["State","Quantity"],["Sun",100],["Mon",300],["Tue",null],
["Wed",400],["Thur",600],["Fri",550],["Sat",200]]; (1)
graph = new EGraph();
elem = new LineElement("State", "Quantity"); (2)
elem.setIgnoreNull(false); (3)
graph.addElement(elem);(4)| 1 | See dataset to use a data block instead of an array literal. |
| 2 | Create the LineElement object. |
| 3 | Use setIgnoreNull to honor the null. |
| 4 | Use EGraph.addElement(elem) to add the LineElement to the Chart. |
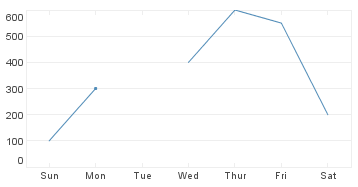
Chart Component Script: Continue Line at Null
dataset = [["State","Quantity"],["Sun",100],["Mon",300],["Tue",null], \
["Wed",400],["Thur",600],["Fri",550],["Sat",200]]; (1)
graph = new EGraph();
elem = new LineElement("State", "Quantity"); (2)
elem.setIgnoreNull(true); (3)
graph.addElement(elem); (4)| 1 | See dataset to use a data block instead of an array literal. |
| 2 | Create the LineElement object. |
| 3 | Use setIgnoreNull to ignore the null. |
| 4 | Use EGraph.addElement(elem) to add the LineElement to the Chart. |
Script that modifies the graph or dataset properties should be placed on the Chart component itself. See Add Component Script for more information. This script has access to the Chart data and Chart API methods. Scripted Charts are not good candidates for user-modification, so you should deselect ‘Enable Ad Hoc Editing’ in the Chart Properties dialog box.
|
|
To change the property on a Chart that was previously created with the Chart Editor, use “getter” methods such as EGraph.getElement(index) ① to obtain a handle to the desired GraphElement object. For example: |