DefaultTextFrame
The DefaultTextFrame object contains data to display in text form, as well as a mapping between these values and any desired replacement text. To create a DefaultTextFrame object, call the DefaultTextFrame constructor.
var frame = new DefaultTextFrame('Quantity');You can pass a field name (e.g., ‘Quantity’) to the constructor in element script , or specify this later using the inherited VisualFrame.setField(field) property. To stylize or reposition text created using a DefaultTextFrame, use the GraphElement.setTextSpec(spec) and GraphElement.setLabelPlacement(value) options. You can also set this using the bindingInfo.textFrame property syntax in onRefresh script . See Example 3 below.
Example 1
Chart Component Script
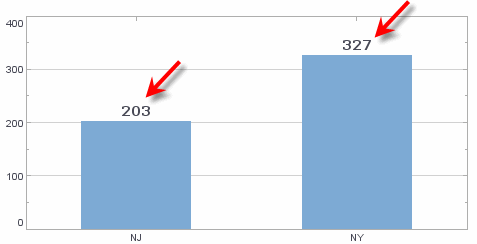
dataset = [["State", "Quantity"], ["NJ",203], ["NY",327]]; (1)
graph = new EGraph();
var elem = new IntervalElement("State", "Quantity");
var spec = new TextSpec();
var frame = new DefaultTextFrame(); (2)
spec.setFont(java.awt.Font('Verdana',java.awt.Font.BOLD, 14));
frame.setField("Quantity");
elem.setTextFrame(frame); (3)
elem.setTextSpec(spec);
graph.addElement(elem);| 1 | See dataset to use a data block instead of an array literal. |
| 2 | Create the DefaultTextFrame object. |
| 3 | Use GraphElement.setTextFrame(frame) to add the TextFrame to the element. |
Script that modifies the graph or dataset properties should be placed on the Chart component itself. See Add Component Script for more information. This script has access to the Chart data and Chart API methods. Scripted Charts are not good candidates for user-modification, so you should deselect ‘Enable Ad Hoc Editing’ in the Chart Properties dialog box.
|
Example 2
Chart Component Script
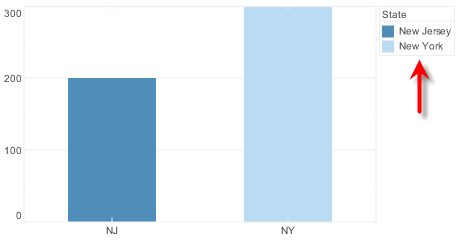
dataset = [["State", "Quantity"], ["NJ",200], ["NY",300]]; (1)
graph = new EGraph();
var elem = new IntervalElement("State", "Quantity");
var cframe = new CategoricalColorFrame();
var tframe = new DefaultTextFrame(); (2)
var spec = cframe.getLegendSpec();
cframe.setField("State");
tframe.setText('NJ','New Jersey'); (3)
tframe.setText('NY','New York'); (3)
spec.setTextFrame(tframe); (4)
elem.setColorFrame(cframe);
graph.addElement(elem);| 1 | See dataset to use a data block instead of an array literal. |
| 2 | Create the DefaultTextFrame object. |
| 3 | Use setText to set the text mapping in the TextFrame. |
| 4 | Use LegendSpec.setTextFrame(frame) to add the TextFrame to the legend. |
Example 3
This example illustrates how to use bindingInfo properties to control the TextFrame.
onRefresh Script
Chart1.bindingInfo.setTextField("Company",Chart.STRING);
Chart1.bindingInfo.textFrame = new DefaultTextFrame;
Dashboard script that modifies bindingInfo should generally be placed in the onRefresh handler. See Add Dashboard Script.
|