AxisSpec.setAbbreviate(Boolean)
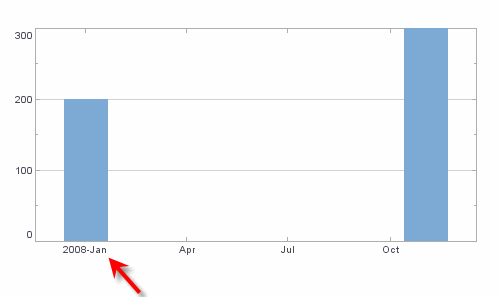
Specifies that the common prefix of TimeScale labels should be omitted to conserve space. This property is only observed when a Date format is specified. Note: There is no corresponding “getter” function.
Example
Chart Component Script
var date1 = new Date();
var date2 = new Date();
date1.setFullYear(2008,0,1);
date2.setFullYear(2008,10,1);
dataset = [["Date", "Quantity"], [date1,200], [date2,300]]; (1)
graph = new EGraph();
var elem = new IntervalElement("Date", "Quantity");
var tscale = new TimeScale("Date");
var aspec = new AxisSpec(); (2)
var tspec = new TextSpec();
tspec.setFormat(java.text.SimpleDateFormat('yyyy-MMM'));
aspec.setTextSpec(tspec);
aspec.setAbbreviate(true); (3)
tscale.setAxisSpec(aspec);
graph.setScale("Date", tscale);
graph.addElement(elem);| 1 | See dataset to use a data block instead of an array literal. |
| 2 | Create the AxisSpec object. |
| 3 | Use setAbbreviate to drop common prefixes. |
Script that modifies the graph or dataset properties should be placed on the Chart component itself. See Add Component Script for more information. This script has access to the Chart data and Chart API methods. Scripted Charts are not good candidates for user-modification, so you should deselect ‘Enable Ad Hoc Editing’ in the Chart Properties dialog box.
|
|
To change the property on a Chart that was previously created with the Chart Editor, use EGraph.getCoordinate() ①, RectCoord.getXScale() ②, and Scale.getAxisSpec() ③ to obtain a handle to the desired Coordinate object, Scale object, and so on. For example: |