Coordinate.setExtent(minX, minY, maxX, maxY)
Sets the extent of a geographical coordinate system (for a map-type chart) to the specified latitudes and longitudes.
Parameter
- minX
-
the minimum longitude
- minY
-
the minimum latitude
- maxX
-
the maximum longitude
- maxY
-
the maximum latitude
Example
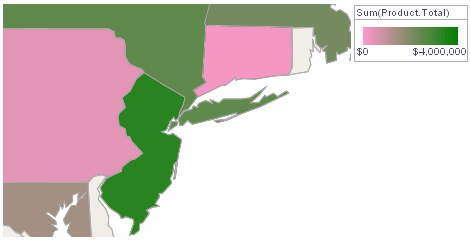
Create a map of the United States. (See Map Chart in Visualize Your Data for more information about adding a map to a Dashboard.) To restrict the range of the map to the region between Washington and Boston, first obtain the latitude and longitude of these cities:
- Washington
-
38.895111 latitude, -77.036667 longitude
- Boston
-
42.358056 latitude, -71.063611 longitude
Add the following Chart script to limit the extent of the map to this range. Note that the X-axis corresponds to longitude, and the Y-axis corresponds to latitude.
Chart Component Script
graph.getCoordinate().setExtent(-77.036667, 38.895111,-71.063611, 42.358056); (1)
graph.getElement(0).setInPlot(false); (2)| 1 | Use setExtent to limit the map range. |
| 2 | Use GraphElement.setInPlot(Boolean) to display only the specified portion of the map. Otherwise, the Chart will force the entire map to display, regardless of the specified extent. |
Script that modifies the graph or dataset properties should be placed on the Chart component itself. See Add Component Script for more information. This script has access to the Chart data and Chart API methods. Scripted Charts are not good candidates for user-modification, so you should deselect ‘Enable Ad Hoc Editing’ in the Chart Properties dialog box.
|