Add Conditional Format (Highlight)
You can apply conditional formatting (highlighting) to Table columns, Images, Text, Crosstabs, and Chart elements. Conditional formatting allows component appearance to change based on the data bound to the element. These conditional formats are called highlights. They are very useful in calling attention to events where data meets (or fails to meet) some specified condition.
To apply a highlight to a Table column, Image, Text, Chart, or Crosstab, follow these steps:
-
Right-click the component you wish to highlight. (For a Table, right-click a data cell in column to which you want the highlight to be applied. For a Chart, right-click on a plot element or an axis label.) Note: You can also access menu options from the ‘More’ button (
 ) in the mini-toolbar.
 -
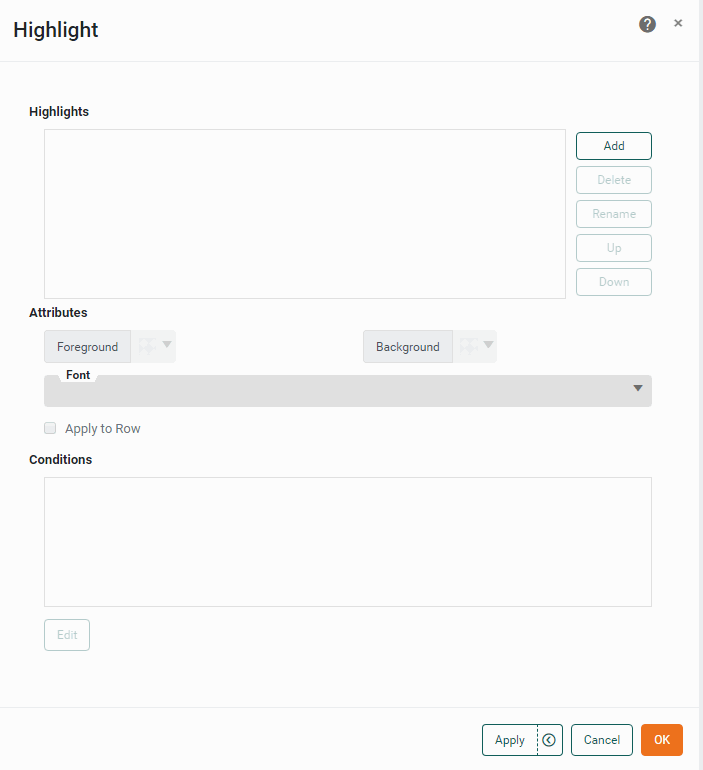
Select ‘Highlight’ from the right-click context menu. This opens the ‘Highlight’ panel.
-
Press the Add button. This opens the ‘Name’ dialog box.
-
Enter a name for this highlight, and press OK to close the dialog box.
-
Repeat the previous steps to enter any additional highlights, and then follow the steps below for each individual highlight.
Multiple highlights allow you to produce composite formats. For example, if you specify a red-foreground highlight for the condition “Discount is greater than 0,” and a bold-font highlight for the condition “State is equal to NJ,” values that meet both conditions will appear highlighted in red and bold. -
Select the highlight in the list that you want to edit.
-
In the ‘Attributes’ panel, select the highlight format. The formatting is applied when the data meets the highlight condition (specified below):
-
Click the ‘Foreground’ color chip to set the text color.
-
Click the ‘Background’ color chip to set the fill color.
-
Click the ‘Font’ menu to make the desired font selections.
-
-
For a Table, select ‘Apply to Row’ if you wish to apply the specified formatting to the entire table row. Otherwise, the formatting applies only to the selected table column.
Cell-based highlights take precedence over row-based highlights. -
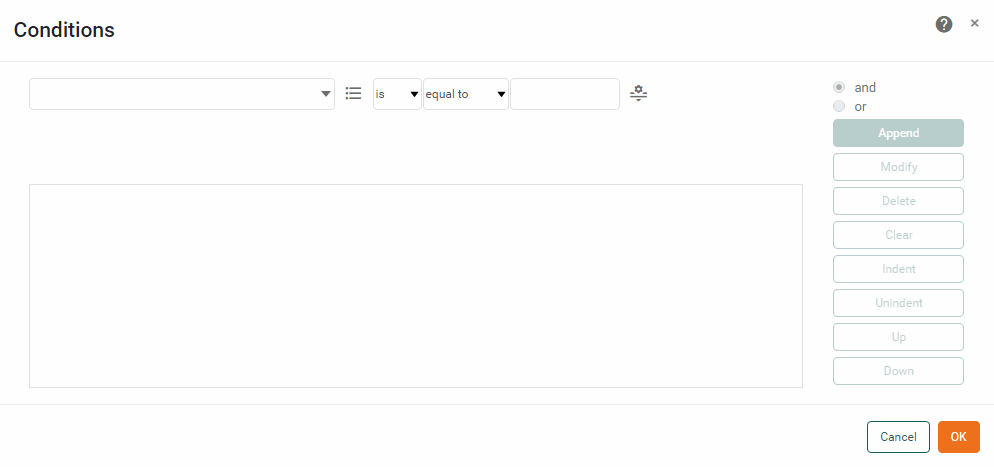
Press the Edit button below the ‘Conditions’ box. This opens the ‘Conditions’ dialog box.
-
Select the operand and type of comparison from the menus at the top of the dialog box, e.g.,
[Company][is not][one of].For Tables, the left-side operand (e.g.,
[Company]) is one of the table column names. To use aggregate fields in a highlight condition for a Freehand Table, first assign a ‘Cell Name’ to the aggregate field in the Freehand Table Editor. See Create a Freehand Table for more information.For Text and Image highlights, the left-side operand is called
value, which is the aggregate value associated with the element, as configured in the Data tab of the element’s ‘Properties’ dialog box. -
Optional: For Table highlighting, select ‘Value’, ‘Field’, ‘Expression’, ‘Session Data’, or ‘Variable’ from the ‘Value Type’ button
 .
.-
If you select the ‘Field’ option, in the adjoining menu choose the Table column for comparison. (The two columns will be compared row by row, and the specified highlight will be applied to every row where the condition holds true.)
-
If you select the ‘Value’ option, either enter the comparison value into the provided text field, or press the ‘Browse Data’ button
 to choose the comparison value from a list.
 -
If you select the ‘Variable’ option, select one of the Form components listed in the menu to provide the value at runtime. (See Dynamically Set Properties for further details.)
-
If you select the ‘Expression’ option, press the JS/SQL button to select JavaScript or SQL syntax, and then press the ‘Edit Expression’ button
 . This opens the Script Editor where you can enter your expression. (See Dynamically Set Properties for details on using expressions.)
-
-
When you have fully specified the condition, press Append.
-
To create a compound condition with multiple clauses, repeat the steps above, using the
[and]and[or]operators to compose the condition clauses. See below: -
Press OK to exit the ‘Condition’ dialog box and return to the ‘Highlight’ dialog box.
-
Repeat the above steps to add additional highlights.
-
Press OK to close the ‘Highlight’ panel.
When you add a highlight to a Table column or Crosstab, the highlight condition is tested individually for each cell. When the condition is satisfied, the corresponding highlight format is applied to the cell or row (if ‘Apply to Row’ is selected).