GShape.ImageShape
The GShape.ImageShape object contains a custom image to be used as a fill pattern with StaticShapeFrame and CategoricalShapeFrame objects. To create an ImageShape object in element script , call the object constructor:
var shape = new GShape.ImageShape();You can provide the image location as input to the constructor, for example:
var shape = new GShape.ImageShape("https://.../image.gif");You can also specify this later using GShape.ImageShape.setImage(image) method in Component script, or using the GShape.ImageShape.image property in onRefresh script. See Example 3 below.
GShape.ImageShape provides the following methods:
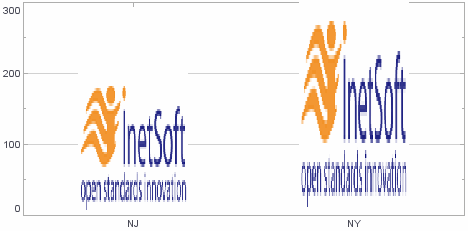
Example 1
dataset = [["State","Quantity"], ["NJ",200], ["NY",300]]; (1)
graph = new EGraph();
var elem = new IntervalElement("State", "Quantity");
var logo = getImage("https://www.inetsoft.com/images/home/logo.gif");
var shape = new GShape.ImageShape(); (2)
shape.image = logo; (3)
var frame = new StaticShapeFrame(shape); (4)
elem.setShapeFrame(frame); (5)
graph.addElement(elem);| 1 | See dataset to use a data block instead of an array literal. |
| 2 | Create the GShape.ImageShape shape. |
| 3 | Use GShape.ImageShape.setImage(image) to assign the desired image to the shape. |
| 4 | Pass the shape to the StaticShapeFrame constructor. |
| 5 | Use GraphElement.setShapeFrame(frame) to add the ShapeFrame to the IntervalElement. |
Script that modifies the graph or dataset properties should be placed on the Chart component itself. See Add Component Script for more information. This script has access to the Chart data and Chart API methods. Scripted Charts are not good candidates for user-modification, so you should deselect ‘Enable Ad Hoc Editing’ in the Chart Properties dialog box.
|
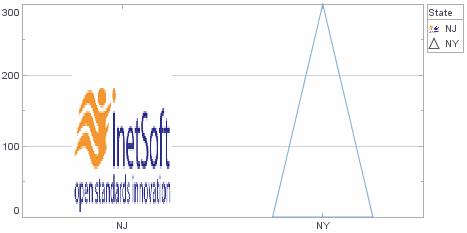
Example 2
dataset = [["State", "Quantity"], ["NJ", 200], ["NY", 300]]; (1)
graph = new EGraph();
var elem = new IntervalElement("State", "Quantity");
var logo = getImage("https://www.inetsoft.com/images/home/logo.gif");
var shape = new GShape.ImageShape(logo); (2)
var frame = new CategoricalShapeFrame("State");
frame.setShape("NJ", shape); (3)
elem.setShapeFrame(frame); (4)
graph.addElement(elem);| 1 | See dataset to use a data block instead of an array literal. |
| 2 | Pass the image to the GShape.ImageShape() constructor to create the shape. |
| 3 | Use CategoricalShapeFrame.setShape(val,shape) to assign the shape to the data. |
| 4 | Use GraphElement.setShapeFrame(frame) to add the ShapeFrame to the IntervalElement. |
Script that modifies the graph or dataset properties should be placed on the Chart component itself. See Add Component Script for more information. This script has access to the Chart data and Chart API methods. Scripted Charts are not good candidates for user-modification, so you should deselect ‘Enable Ad Hoc Editing’ in the Chart Properties dialog box.
|
Example 3
This example illustrates how to use bindingInfo properties to control the ShapeFrame.
-
Bind a Point Chart to the sample ‘All Sales’ Data Worksheet, with ‘Company’ (top 5) on the X-axis, and Sum(Total) on the Y-axis.
The ‘All Sales’ Data Worksheet can be found in the folder. You may need to download the examples.zip file from GitHub into your environment. (This requires access to Enterprise Manager.) See Import and Export Assets for instructions on how to import. -
Add the following script in the onRefresh handler. (See Add Dashboard Script.)
onRefresh ScriptChart1.bindingInfo.setShapeField('Employee',Chart.STRING); var logo = getImage("https://www.inetsoft.com/images/home/logo.gif"); var shape = new GShape.ImageShape(); shape.image = logo; var frame = new StaticShapeFrame(shape); Chart1.bindingInfo.shapeFrame = frame;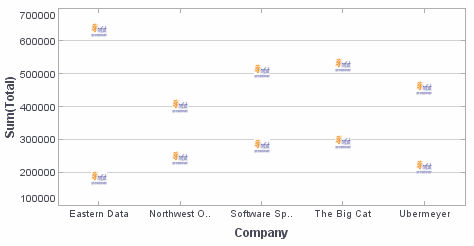
Dashboard script that modifies bindingInfoshould generally be placed in the onRefresh handler. See Add Dashboard Script.