Modify Chart Data Binding
The Chart bindingInfo property provides access to the data binding options in the Chart’s ‘Data Binding’ dialog box. This includes the binding of fields to the X-axis, Y-axis, and VisualFrames (Color, Shape, etc.), as well as grouping and summarization settings.
Walkthrough
In the following example, you will bind a chart to the ‘All Sales’ Data Worksheet, set the axis bindings, define a subseries, and set grouping and summarization. Follow the steps below:
-
Create a Dashboard. Select the ‘All Sales’ Data Worksheet as the data source. (See Create a New Dashboard.)
The ‘All Sales’ Data Worksheet can be found in the folder. You may need to download the examples.zip file from GitHub into your environment. (This requires access to Enterprise Manager.) See Import and Export Assets for instructions on how to import. -
Add a new Chart component to the Dashboard. (The default name of this Chart is “Chart1”.)
-
Press the ‘Options’ button
 in the toolbar to open the ‘Dashboard Options’ dialog box, then select the Script tab to open the onRefresh Handler.
Changest to the bindingInfoproperty must in general be made prior to query execution. Therefore, attachbindingInfoscripts to the onRefresh handler. -
In onRefresh Handler in the Script Editor, enter the commands below:
-
Bind the chart to the ‘All Sales’ data block.
Chart1.query = "All Sales"; -
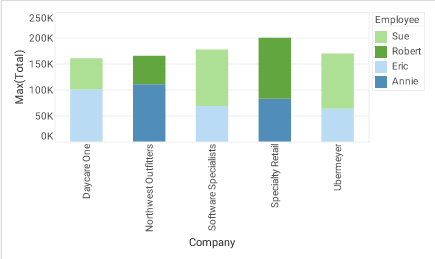
Specify query fields to bind to the X-axis (‘Company’) and Y-axis (‘Total’):
Chart1.bindingInfo.xFields = [["Company",Chart.STRING]]; Chart1.bindingInfo.yFields = [["Total",Chart.NUMBER]]; -
Set the aggregation/summarization method:
Chart1.bindingInfo.setFormula("Total",Chart.MAX_FORMULA) -
Set the desired grouping options (e.g., top-N filtering):
Chart1.bindingInfo.setTopN("Company",5) Chart1.bindingInfo.setTopNReverse("Company",false) Chart1.bindingInfo.setTopNSummaryCol("Company","Max(Total)"); -
Specify the query fields to bind to a ColorFrame (i.e., for color-coding as subseries):
Chart1.bindingInfo.setColorField("Employee",Chart.STRING);
-
-
Close the Editor and press the ‘Preview’ button
 to preview the Dashboard.