Create a Table
Watch Video: Creating a Dashboard (Add a Table)
This video might show an earlier version of the feature or operation that differs in minor ways from the current version.
The following sections explain how to add and configure a regular Table, which allows you to display tabular data in raw (unaggregated) form.
Add a Table Component
-
If necessary, create a new Dashboard. (See Create a New Dashboard.)
-
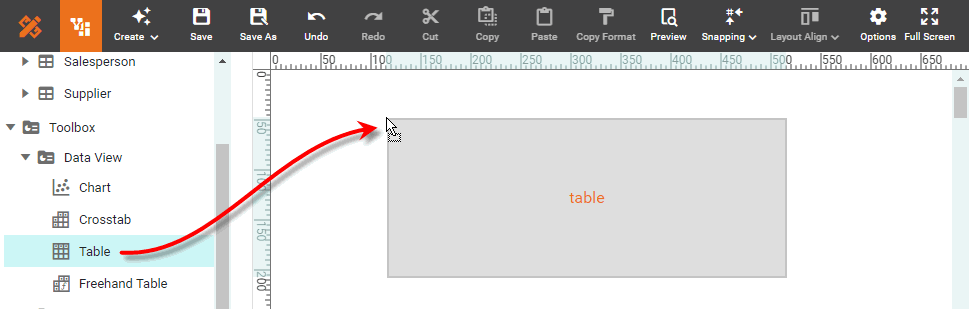
Drag a Table component from Toolbox panel into the Dashboard to create a blank table.
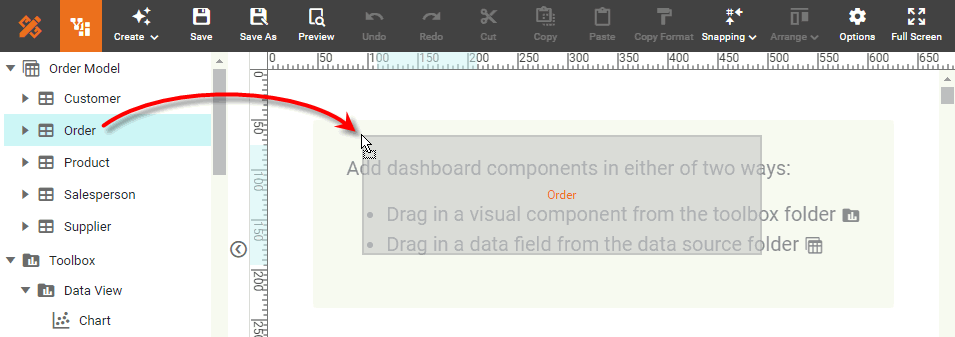
You can also drag an entire data block into the Dashboard. This adds the data block as a new Table. Then proceed with the steps below.
-
Press the ‘Edit’ button
 on the Table to open the Table Editor.
 -
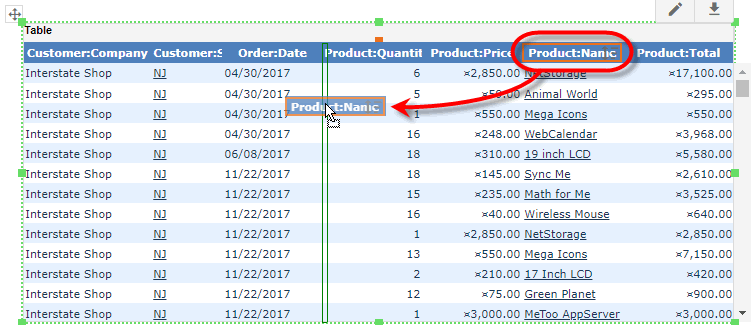
In the Table Editor, drag individual columns from a data block into the ‘Details’ region, or onto the Table itself. The green highlight shows you where each column will be placed.
If you want to add data from multiple data blocks into the Table, you must first join them together. See Join Data in Prepare Your Data. Data models are already fully joined, and all attributes can be used in a Table. 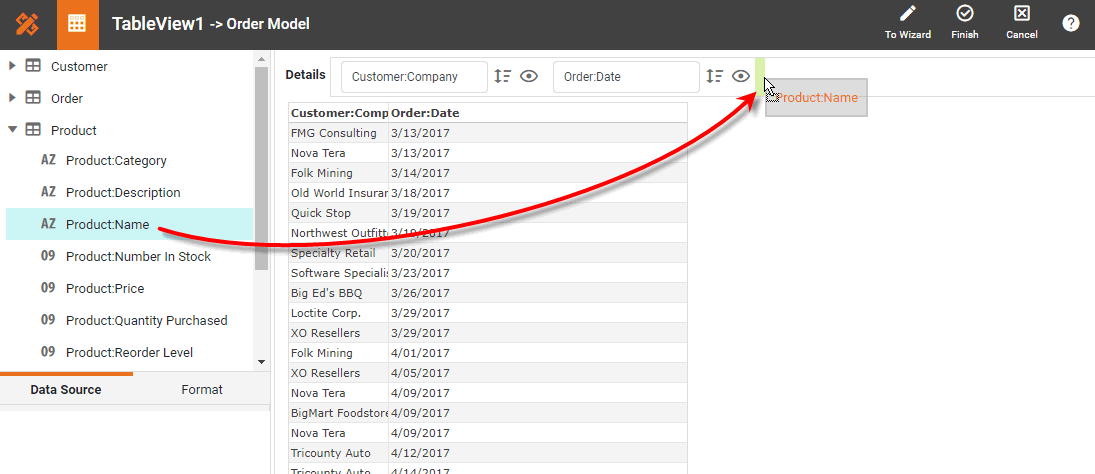
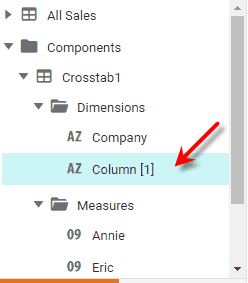
If the Dashboard contains other Tables or Crosstabs, you can use the data in those components as the data source. Simply expand the ‘Components’ folder, and select the desired fields.
There are two restrictions on binding a component to another component’s data:
-
This option is not available in meta-data mode. See Dashboard Options for information about meta-data mode.
-
You will not be able to filter the component using a Selection List or Range Slider. However, you can still filter the component by using a condition (see Add Conditions).
-
-
Optional: To hide a column, press the ‘Show/Hide’ button
 . To remove the column entirely, drag the column back to the left Data Source panel.
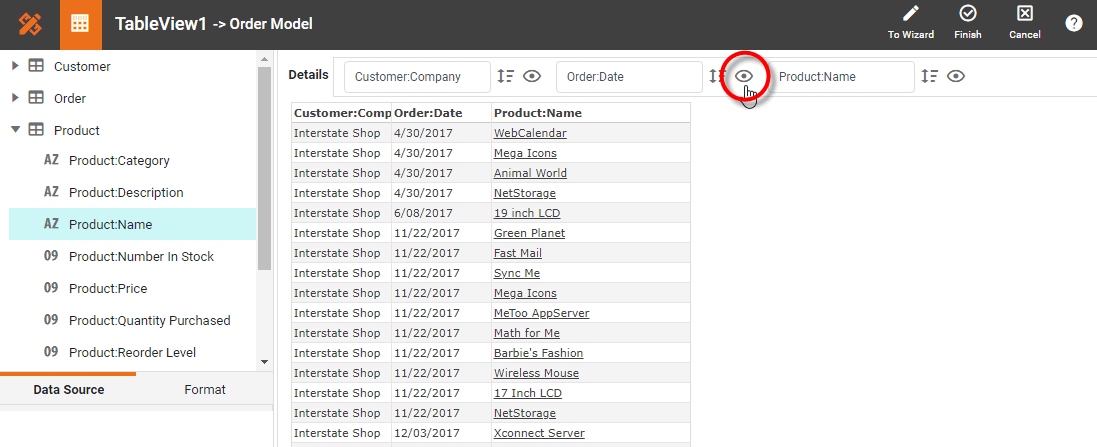
-
Optional: To sort a column, press the ‘Sort’ button
 . Press once to sort in ascending order, press again to sort in descending order, press a third time to return to the original order. (You can sort on both visible and hidden columns.)
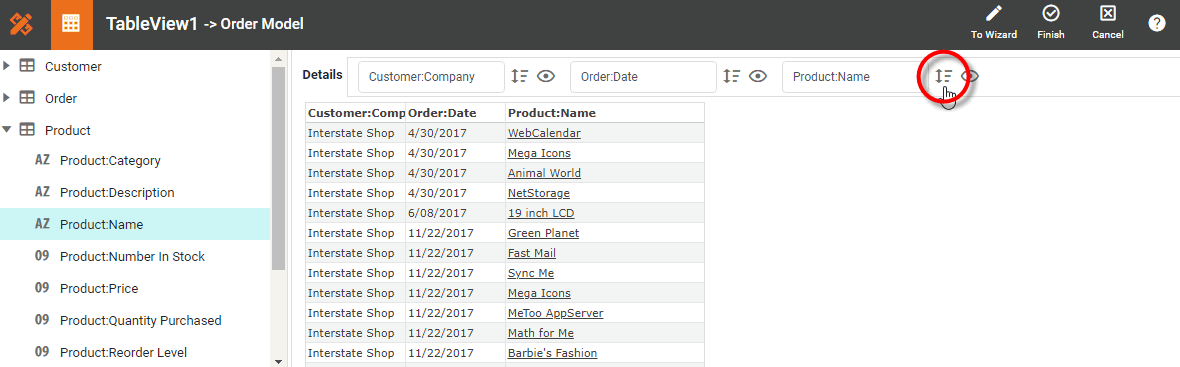
-
Press the ‘Finish’ button
 to close the Editor.
 -
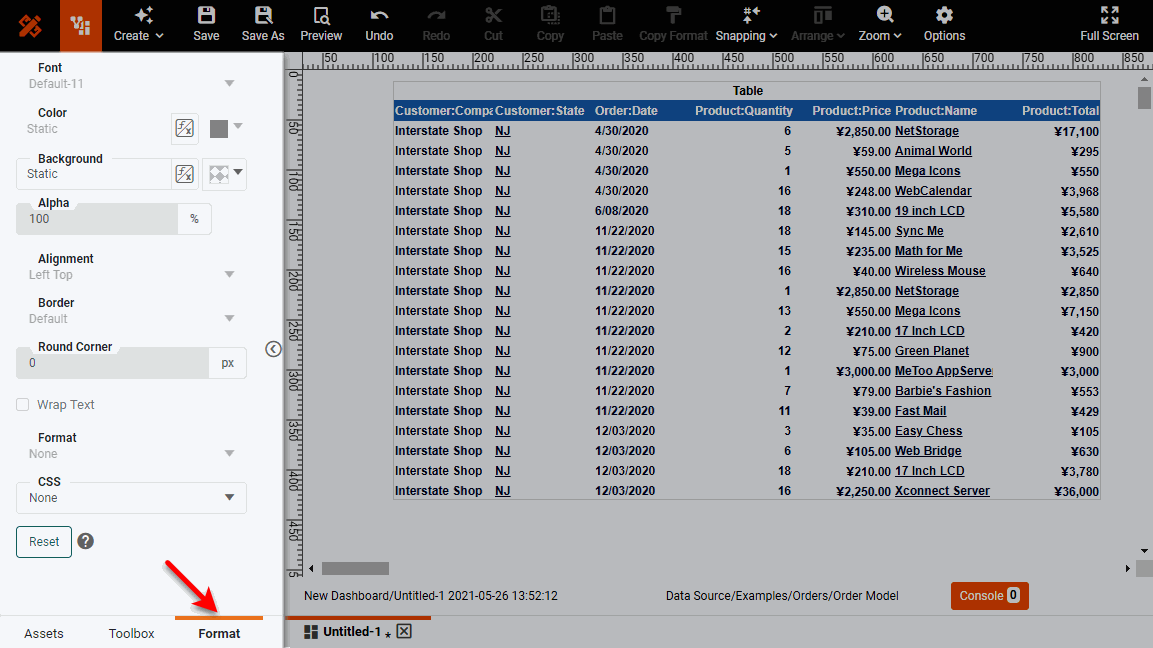
Format the table as desired. To do this, select the Format tab at the bottom of the left panel. (Or right-click the component and select ‘Format’ from the context menu.) See Configure Table Appearance below for more information.
Configure Table Appearance
The following sections explain how format a Table.
Style a Table
To apply a global Table Style, right-click the table and select ‘Properties’ from the context menu. Note: You can also access menu options from the ‘More’ button ( ) in the mini-toolbar. This opens the ‘Table Properties’ panel. In the ‘Table Styles’ region of the General tab, select a table style. Press OK.
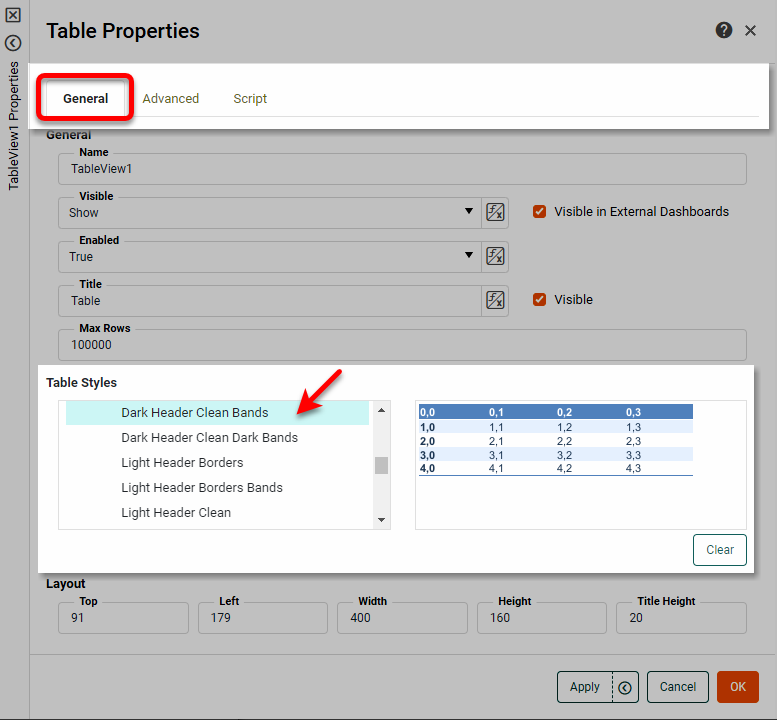
This applies a global style to the table, including fonts, background colors, foreground colors, and borders.
Resize a Table
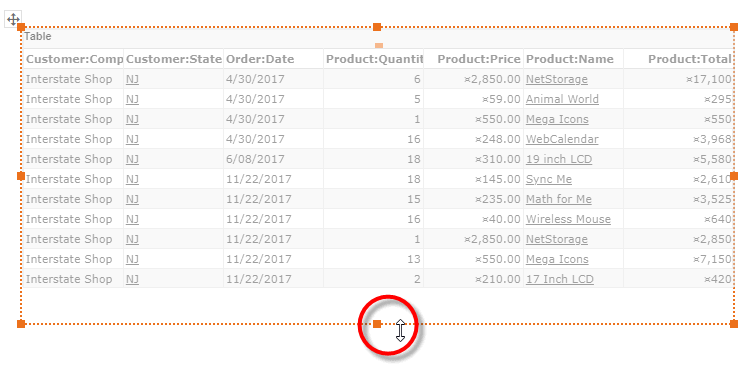
To resize a Table, click the table to select it. Drag the bottom border of the table to display more rows. Drag the right border to display more columns.
Resize a Column
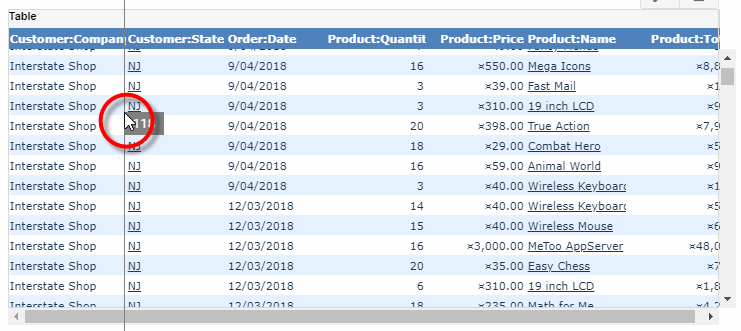
To resize a column, drag the column borders as desired.
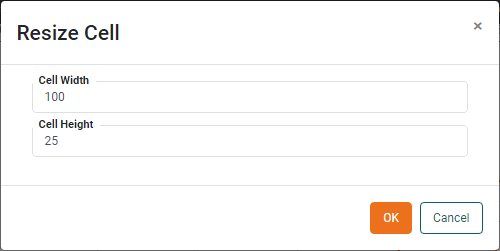
You can also right-click a cell and select ‘Set Cell Size’. This opens the ‘Resize Cell’ dialog box, where you can specify the cell dimensions in pixels.
To hide a table column entirely, use the Table Editor as described above. To display all columns, right-click the Table and select ‘Show Columns’ from the context menu.
Align Header and Data Cells
To align a column header, click the column header to select it (hold the Ctrl or Shift key and click to select multiple columns). Then press the desired alignment button in the Format panel to align the header text.
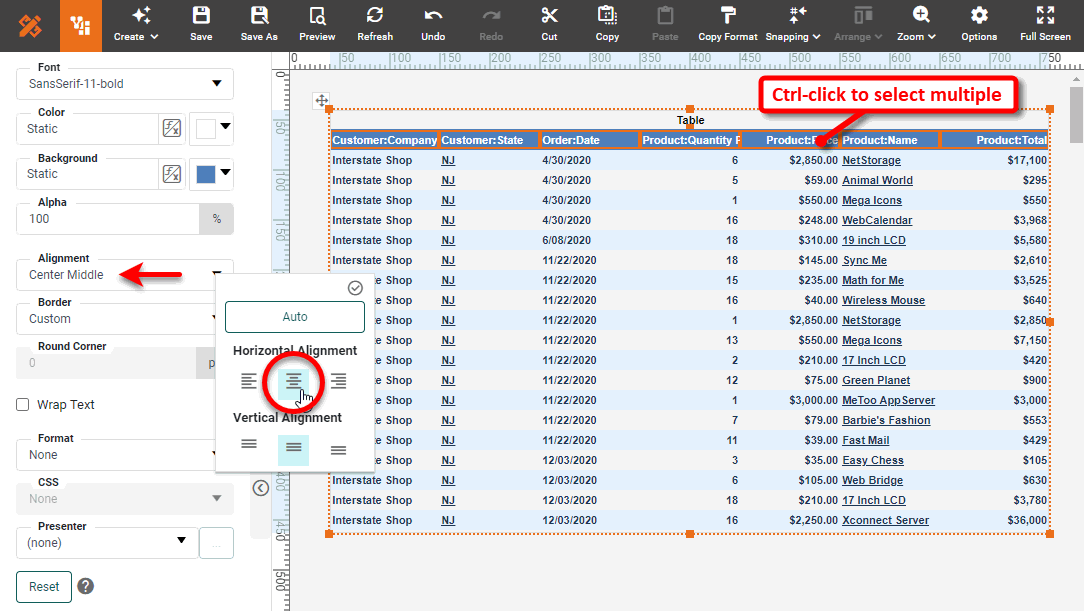
To align the data values in a column, select any cell in the column, and choose select the desired alignment option in the Format panel.
Format a Column as Currency
To format a column’s data as currency, select any cell in the column and choose the ‘Currency’ option from the ‘Format’ menu in the Format panel. Press the ‘Apply’ button . See Add Data Format for more details about formatting.

Format a Column as Date
To format a column’s data as a date, select any cell in the column and choose the ‘Date’ option from the ‘Format’ menu in the Format panel.
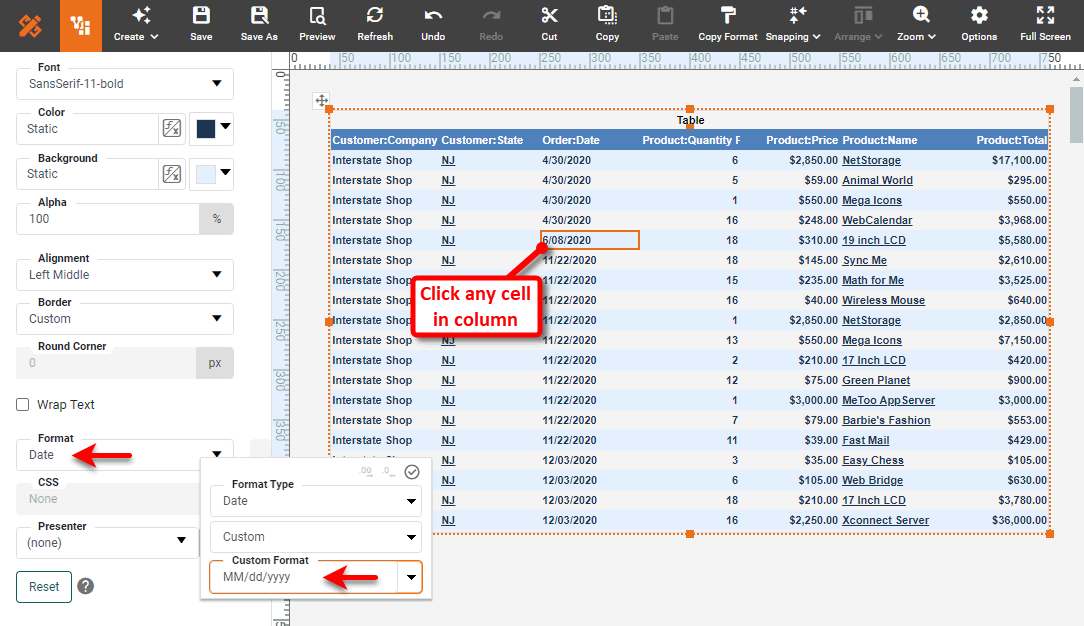
Select a date code from the menu or select ‘Custom’ and enter your own. (For example, the code MM/dd/yyyy indicates that dates should be displayed with a two-digit month, two-digit day, and four-digit year.) Press the ‘Apply’ button . See Add Data Format for more details about formatting.
Format a column as Number
To format a column’s data as a number, select any cell in the column and choose the ‘Number’ option from the ‘Format’ menu in the Format panel.
Select a number code from the menu or select ‘Custom’ and enter your own. (For example, the code #,##0.00 indicates that numbers in the column should have a comma every three places to the left of the decimal, and two digits to the right of the decimal.) Press the ‘Apply’ button . See Add Data Format for more details about formatting.