Coordinate.setFullMap(Boolean)
Specifies, when true, that the entire map should be displayed within the element’s borders. Otherwise, only regions of the map representing data are displayed, and other regions are cropped.
Parameter
- Boolean
-
true: fit entire map in chart borders (default)
false: fit only data regions in chart borders
Example
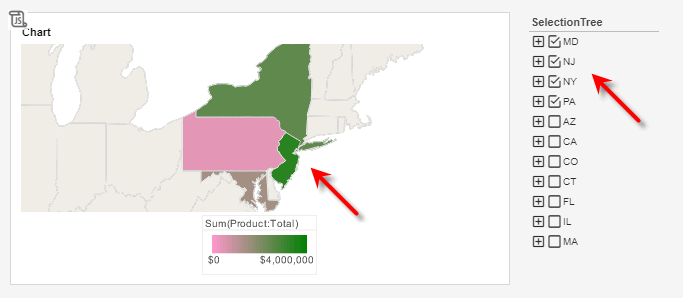
Create the map below. See the example for drillMembers in Advanced Dashboard Scripting. To zoom the map to display only the selected regions, add the following script to the Chart component:
Chart Component Script
var zoomed = SelectionTree1.selectedObjects.length > 0; (1)
graph.getCoordinate().setFullMap(!zoomed); (2)
graph.getElement(0).setInPlot(!zoomed); (3)| 1 | If there are selected items, set zoomed to true. |
| 2 | If zoomed=true, use setFullMap(false) to display only selected data. |
| 3 | Use GraphElement.setInPlot(Boolean) to display only the specified portion of the map. Otherwise, the Chart will force the entire map to display, regardless of the setFullMap setting. |
Script that modifies the graph or dataset properties should be placed on the Chart component itself. See Add Component Script for more information. This script has access to the Chart data and Chart API methods. Scripted Charts are not good candidates for user-modification, so you should deselect ‘Enable Ad Hoc Editing’ in the Chart Properties dialog box.
|