Load Assets via URL
The following sections show you how to display User Portal components via URL. (HTTP requests can be submitted with both the GET and POST methods.) To embed User Portal components into your web application, use the supplied URLs with an IFrame.
Embedding in an IFrame is only permitted if SSL is configured. Set security.allow.iframe=true if SSL is configured. See All Properties for information on how to set properties.
|
For example, to embed the contents of the Repository tab of the Portal for a server running on http://www.example.com, use the following:
<iframe src="https://www.example.com/app/portal/tab/report?hideNav=true" allowfullscreen>
</iframe>
Display a Portal Tab
To display a single tab (Repository, Dashboard, Schedule) of the User Portal, use the following URL:
Set hideNav=true to hide the top Portal navigation bar. Set hideNav=false (or omit the hideNav argument) to display the top Portal navigation bar, which allows the user to select a different Portal tab.
To display the contents of a custom Portal tab, use the following syntax:
| For information on how to create a custom tab, see Portal Integration in Manage the Server. |
Display a Dashboard
|
The following sections explain how to display a Dashboard by URL, and within an IFrame.
Open a Public Dashboard
To open an individual Dashboard, use the following URL:
where DashboardName is the name of the desired Dashboard, and DashboardPath gives the names (not the aliases) of the Dashboard’s containing folders in the Repository, e.g., Folder1/Folder2/….
To open the Dashboard within the Repository tab of the User Portal, use the following syntax:
Use %20 to represent a space in a Dashboard name. Use the actual names of the Dashboard or folder. Do not use aliases.
|
|
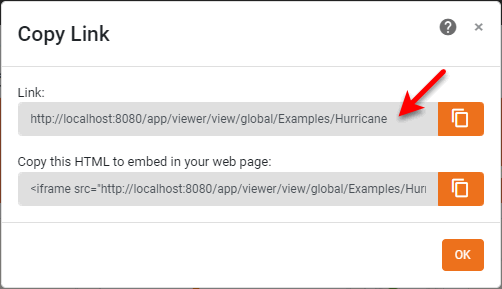
The easiest way to obtain the correct URL for an asset is to open the asset in the Portal and use the ‘Social Sharing’ button
You can also use the encoded form of the path obtained from encodeURI(uri). |


Open a Private Dashboard
For a private Dashboard (a user Dashboard that appears under the ‘My Dashboards’ folder in the repository or under the ‘Private Dashboard’ folder in Visual Composer), the path should begin with the username. For example, for user ‘Eric’ and a user (private) Dashboard called ‘MyDashboard’ in a folder called ‘My Folder’, the path should be specified as follows:
| The path does not explicitly reference the ‘My Dashboards’ folder. |
To open a private Dashboard within the Repository tab of the User Portal, use the following syntax:
Use %20 to represent a space in a Dashboard name. Use the actual names of the Dashboard or folder. Do not use aliases.
|
|
The easiest way to obtain the correct URL for an asset is to open the asset in the Portal and use the ‘Social Sharing’ button
You can also use the encoded form of the path obtained from encodeURI(uri). |
Set Open Graph Tags
If a Dashboard includes a title/alias or description, then the title/alias or description is used to set og:title and og:description Open Graph tags. Otherwise, the ‘Open Graph Title’ and ‘Open Graph Description’ Social Sharing properties are used to set og:title and og:description. See Social Sharing for more information.
Embed a Dashboard in an IFrame
To embed a Dashboard within an IFrame, use the URLs provided above, for example, for a server running on http://www.example.com:
<iframe src="https://www.example.com/app/viewer/view/global/DashboardPath/DashboardName allowfullscreen>
</iframe>
Embedding in an IFrame is only permitted if SSL is configured. Set security.allow.iframe=true if SSL is configured. See All Properties for information on how to set properties.
|
Communicate with Parent Page of IFrame
If the Dashboard is being displayed within an IFrame, you can allow the Dashboard to communicate with its parent window by using a hyperlink in the Dashboard to trigger a JavaScript MessageEvent in the parent window. (The parent window does not need to have the same domain as the InetSoft server.) The hyperlink in the Dashboard should begin with the prefix “message:”, for example, “message: Hyperlink was clicked”.
The parent page should capture the message event transmitted from the hyperlink by using a script like the one below (placed within <script></script> tags). Note that the event.data.message property contains the message text relayed by the hyperlink, while the event.data.params contains Dashboard parameters.
window.addEventListener("message", receiveMessage, false);
function receiveMessage(event) {
    // Verify that message was sent by the InetSoft server:
    if (event.origin !== "http://localhost:8080") {
        return;
    }
    console.log("Full event data: " + JSON.stringify(event.data));
    if (event.data.message == "Hyperlink was clicked") {
        // do actions for hyperlink click
    }
    if (event.data.params._USER_ == "anonymous") {
        // do actions for anonymous user
    }
}| For more information about hyperlinks, see Drill Down into Data in Visualize Your Data, and hyperlink and setHyperlink(row, col, hyperlink) in Advanced Dashboard Scripting. |
Adapt Size of IFrame to Browser Size
A JSON message will be automatically triggered when the Dashboard has the ‘Scale to Screen’ option enabled (see Dashboard Options) and the scrollHeight of the dashboard changes, for example, { scrollHeight: 123 }. This message can be used to dynamically resize the IFrame to prevent the introduction of scroll bars. For example (place script inside <script></script> tags):
window.addEventListener("message", event => {
    document.querySelector("iframe").style.height = event.data.scrollHeight + 35 + "px";
});
Control Toolbar Buttons from Parent Page
If the Dashboard is being displayed within an IFrame, you can allow the parent page to control the toolbar buttons on the Dashboard. (This allows you to create your own toolbar outside the IFrame to control the Dashboard within the IFrame.) The status of toolbar buttons in the Dashboard can also be communicated to the parent window. (The parent window does not need to have the same domain as the InetSoft server.)
The following three objects (with properties listed) are provided to facilitate communication:
- ViewerToolbarButtonCommand
-
-
identifier of Dashboard
-
name of Dashboard toolbar button
-
- ViewerToolbarEvent
-
-
identifier of Dashboard
-
buttonStatuses array of
ViewerToolbarButtonStatus
-
- ViewerToolbarButtonStatus
-
-
name of Dashboard toolbar button
-
visible status of toolbar button
-
disabled status of toolbar button
-
To pass a message into the Dashboard, use postMessage as shown below, where <buttonName> is the name of a button, such as ‘Email’. (See thisViewsheet for a list of button names.)
var iframe = document.getElementsByTagName("iframe")[0].contentWindow;
iframe.postMessage({ identifier: "1", name: <buttonName>}, "*");
To obtain the button status from the Dashboard within the IFrame, use an event listener and event.data.buttonStatuses, which has properties disabled, visible, and name. The identifier for the Dashboard is provided by the event.data.identifier property.
window.onmessage = function (event) {
   var id = event.data.identifier;
   if (id) {
      var buttonStatuses = event.data.buttonStatuses;
      for (var buttonStatus of buttonStatuses) {
         var str1 = 'Button name: ' + buttonStatus.name;
         var str2 = ', Visible: ' + buttonStatus.visible;
         var str3 = ', Disabled: ' + buttonStatus.disabled;
         alert(str1 + str2 + str3);
         }
      }
   }
};
Export a Dashboard
To export a global (shared) Dashboard, use the following URL:
where DashboardName is the name of the desired Dashboard, and DashboardPath gives the names (not the aliases) of the Dashboard’s containing folders in the Repository, e.g., Folder1/Folder2/….
The {export_type} can be one of the following:
-
PDF: PDF file -
PPT: PowerPoint file -
PPTX: PowerPoint file -
XLS: Excel spreadsheet -
XLSX: Excel spreadsheet -
PNG: PNG image -
HTML: HTML file -
CSV: Comma separated value text file (see below) -
VSO: Dashboard archive for debugging purposes
Use %20 to represent a space in a Dashboard name. Use the actual names of the Dashboard or folder. Do not use aliases.
|
|
The easiest way to obtain the correct URL for an asset is to open the asset in the Portal and use the ‘Social Sharing’ button
You can also use the encoded form of the path obtained from encodeURI(uri). |
For CSV export, if you omit parameter tableAssemblies, all Dashboard tables are exported. To export particular tables, use parameter tableAssemblies as follows:
You can set additional CSV options as well: ‘Delimiter’, ‘Quote’, ‘Tab Delimited’, and ‘Keep Header’. (See Export a Dashboard for more information about these options.)
For a private Dashboard (i.e., a Dashboard that appears under the ‘My Dashboards’ folder in the repository or under the ‘Private Dashboard’ folder in Visual Composer), the path should begin with the username. For example, for user ‘Eric’ and a user (private) Dashboard called ‘MyDashboard’ in a folder called ‘My Folder’ the path should be specified as follows:
| The path does not explicitly reference the ‘My Dashboards’ folder. |
|
The easiest way to obtain the correct URL for an asset is to open the asset in the Portal and use the ‘Social Sharing’ button
You can also use the encoded form of the path obtained from encodeURI(uri). |
Display a Portal Dashboard
The Dashboard tab of the User Portal provides quick access to Dashboards. These Dashboards can be deployed either by a user (see Pin a Dashboard) or by an administrator (see Portal Dashboards in Manage the Server).
To open a deployed Dashboard within the Dashboard tab of the User Portal, use the following syntax:
Use %20 to represent a space in a Dashboard name. Use the actual names of the Dashboard or folder. Do not use aliases.
|
If the Dashboard has been deployed by an administrator (rather than the user), append the string __GLOBAL to the Dashboard name.
To display a Dashboard that has not been deployed as a Portal Dashboard, see Display a Dashboard.
Set Open Graph Tags
If a Dashboard includes a title/alias or description, then the title/alias or description is used to set og:title, and og:description Open Graph tags. Otherwise, the ‘Open Graph Title’ and ‘Open Graph Description’ Social Sharing properties are used to set og:title and og:description. See Social Sharing for more information.
Pass Parameters to a Dashboard
|
To pass parameters to a Dashboard that you open via URL, add the desired parameter/value pairs to the URL:
param1=value1¶m2=value2¶m3=value3&...
Use %20 to represent a space in a Dashboard name. Use the actual names of the Dashboard or folder. Do not use aliases.
|
The transmitted parameter(s) will be available in the Dashboard through the parameter script object and in parameterized filtering conditions. See Display a Dashboard for additional information about opening a Dashboard.
Display an Interactive Chart
To display a fully interactive chart from a specified global (shared) dashboard, use the following URL form.
The ChartID is the name of the Chart in the Dashboard, and DashboardPath is the path of the Dashboard containing the Chart, e.g., Folder1/Folder2/SalesDashboard.
|
The easiest way to obtain the correct URL for an asset is to open the asset in the Portal and use the ‘Social Sharing’ button
You can also use the encoded form of the path obtained from encodeURI(uri). |
To display a chart from a specified user (private) dashboard, use the following URL form:
You can also use the following form for either global or user dashboard:
IFrame Embedding
You can embed an interactive chart within another web page by using any of the above URL forms with an IFrame, for example:
<iframe frameBorder="0" scrolling="no"
src="http://hostname:8080/app/embed/chart/global/DashboardPath/ChartID"
width="400px" height="400px">
</iframe>
The advantages of using an IFrame to embed a chart are the simplicity of this approach, the isolation of the chart from the surrounding web content, and the ability to host the chart in a different domain (cross-domain embedding). Disadvantages of the IFrame’s isolation are that communication between the IFrame context and host web page context can be difficult, which may also complicate the coordination of styling. From a performance standpoint, because each additional IFrame creates a new document context, the use of multiple IFrames in a web page may negatively impact overall responsiveness.
An alternative to using IFrames that may address some disadvantages is custom embedding using web components. See Embed an Interactive Chart for more information.
Embed an Interactive Chart
The simplest way to embed an interactive chart is with an IFrame. (See Display an Interactive Chart for details.) In cases when an IFrame is not appropriate, however, you can instead use the custom chart component <inetsoft-chart>. The chart URL for the chart component can use the same three forms as the IFrame:
You will need to import elements.js and elements.css, which are included with the server installation. The example below embeds two charts within the host web page.
For embedding within an existing web application, you should specify both the webapp <base> and the <inetsoft-base> and import files relative to the webapp base (not relative to the InetSoft base).
|
<!DOCTYPE html>
<html>
<head>
  <base href="/your/webapp/base/">
  <inetsoft-base href="/sree/app"></inetsoft-base>
  <style>
  .flex-container {
    display: flex;
    flex-wrap: wrap;
    width: 100%;
    height: 100%;
    overflow: auto;
  }
  .flex-container > div {
    width: 500px;
    height: 500px;
    position: relative;
  }
  </style>
  <!-- import elements css relative to base href -->
  <link rel="stylesheet" type="text/css" href="../../../sree/app/elements.css">
</head>
<body>
  <div class="flex-container">
    <div>
    <inetsoft-chart url="1%5E128%5E__NULL__%5EExamples/Census/Chart">
    </inetsoft-chart>
    </div>
    <div>
    <inetsoft-chart url="1%5E128%5E__NULL__%5EExamples/Sales%20Summary/Chart4">
    </inetsoft-chart>
    </div>
  </div>
  <!-- import elements js relative to base href -->
  <script src="../../../sree/app/elements.js"></script>
</body>
</html>
The advantages of using the custom chart component rather than the IFrame approach are improved performance when embedding multiple charts, and easier integration with other libraries. However, if you need to embed a chart hosted at another domain, you will need to use the IFrame approach. (See Display an Interactive Chart.)
To prevent styles of the host web page from inadvertently applying to the component, you can add the component to the shadow DOM. An example is shown below:
<!DOCTYPE html>
<html>
<head>
<base href="/your/webapp/base/">
<inetsoft-base href="/sree/app/"></inetsoft-base>
<style>
  .flex-container {
    display: flex;
    flex-wrap: wrap;
    width: 100%;
    height: 100%;
    overflow: auto;
  }
</style>
<script>
  window.onload = function (event) {
    const host = document.querySelector("#host");
    const shadow = createShadowRoot(host);
    addChartToShadow(shadow, "1%5E128%5E__NULL__%5EExamples/Census/Chart");
    addChartToShadow(shadow, "1%5E128%5E__NULL__%5EExamples/Sales%20Summary/Chart4");
  }
  function createShadowRoot(host) {
    const shadow = host.attachShadow({mode: "open"});
    // import elements.css inside shadow root
    const linkElement = document.createElement('link');
    linkElement.setAttribute('rel', 'stylesheet');
    linkElement.setAttribute('href', '../../../sree/app/elements.css');
    shadow.appendChild(linkElement);
    return shadow;
  }
  function addChartToShadow(shadowRoot, url) {
    const inetChart = Object.assign(document.createElement("inetsoft-chart"), {
      url: url,
      style: "width:500px;height:500px;display:block;position:relative;"
    });
    shadowRoot.appendChild(inetChart);
  }
</script>
<!-- import elements css relative to base href -->
<link rel="stylesheet" type="text/css" href="../../../sree/app/elements.css">
<!-- import parent app css, etc -->
<!-- <link rel="stylesheet" type="text/css" href="yourWebapp.css"> -->
</head>
<body>
<div class="flex-container" id="host">
  <!-- shadow root will be added to this host -->
</div>
<!-- import elements js relative to base href -->
<script src="../../../sree/app/elements.js"></script>
</body>
</html>
Display a Static Chart
To display a chart from a specified Dashboard as a PNG image, use the following URL.
where GraphElementID is the ID of the Chart in the Dashboard, DashboardName is the name of the Dashboard containing the Chart, and DashboardPath gives the names (not the aliases) of the Dashboards’s containing folders in the Repository, e.g., Folder1/Folder2/….
Use %20 to represent a space in a Dashboard name. Use the actual names of the Dashboard or folder. Do not use aliases.
|
To display a chart from a specified global (shared) Dashboard as an image, use the following URL:
To display a chart from a specified user (private) Dashboard as an image, use the following URL:
The ChartName is the name of the Chart in the Dashboard, DashboardPath is the path of the Dashboard containing the Chart, e.g., Folder1/Folder2/SalesDashboard. Omit svg=true to return the image in PNG format rather than SVG. Omit width and height to use the default size of the Chart in the Dashboard. If you specify only one dimension (width or height), the Chart is scaled to the specified dimension while maintaining its default aspect ratio.
Display Portal Preferences
To display the Portal ‘Preferences’ dialog box from the Dashboards tab in the Portal, use the following URL:
To open the Portal ‘Preferences’ dialog box from the Repository tab in the Portal, use the following URL: