TimeScale.setMax(value)
Specifies the latest date on the scale. The corresponding “getter” function is getMax().
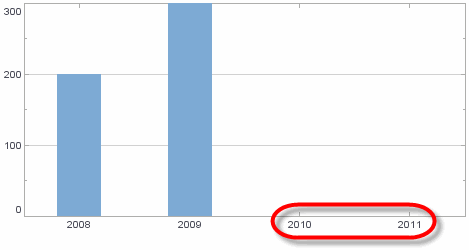
If you set the maximum scale value smaller than the largest data value (to crop the data), you should also set elem.setInPlot(false). See GraphElement.setInPlot(Boolean). Otherwise, the chart will force the data to appear in its entirety, resulting in a partially unlabeled axis.
Parameter
- value
-
a Date object
Example
Chart Component Script
var date1 = new Date();
var date2 = new Date();
var maxDate = new Date();
date1.setFullYear(2008,0,1);
date2.setFullYear(2009,0,1);
maxDate.setFullYear(2011,0,1);
dataset = [["Date", "Quantity"], [date1,200], [date2,300]]; (1)
graph = new EGraph();
var elem = new IntervalElement("Date","Quantity");
var tscale = new TimeScale(); (2)
tscale.setFields(["Date"]);
tscale.setMax(maxDate); (3)
graph.setScale("Date", tscale); (4)
graph.addElement(elem);| 1 | See dataset to use a data block instead of an array literal. |
| 2 | Create the TimeScale object. |
| 3 | Use setMax to set the desired maximum. |
| 4 | Use EGraph.setScale(field, scale) to assign the Scale to the Chart. |
Script that modifies the graph or dataset properties should be placed on the Chart component itself. See Add Component Script for more information. This script has access to the Chart data and Chart API methods. Scripted Charts are not good candidates for user-modification, so you should deselect ‘Enable Ad Hoc Editing’ in the Chart Properties dialog box.
|
|
To change the property on a Chart that was previously created with the Chart Editor, use “getter” methods such as EGraph.getElement(index) ①, GraphElement.getColorFrame() ②, and VisualFrame.getScale() ③ to obtain a handle to the desired GraphElement, ColorFrame, and Scale. For example: |