MultiTextFrame.setFields(arr)
Specifies the columns containing the text specifications. The corresponding “getter” function is getFields().
Example
Chart Component Script
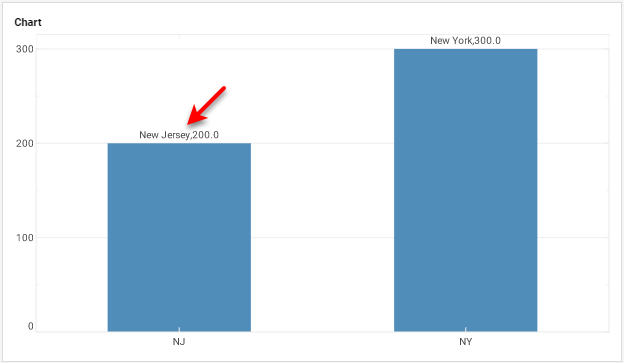
dataset = [["State", "Name", "Quantity"], ["NJ", "New Jersey", 200], ["NY", "New York", 300]]; (1)
graph = new EGraph();
var elem = new IntervalElement("State", "Quantity");
var mtframe = new MultiTextFrame(); (2)
mtframe.setFields("Name","Quantity"); (3)
elem.setTextFrame(mtframe); (4)
graph.addElement(elem);| 1 | See dataset to use a data block instead of an array literal. |
| 2 | Create the MultiTextFrame object. |
| 3 | Use setFields to specify the fields for the MultiTextFrame. |
| 4 | Use GraphElement.setTextFrame(frame) to add the MultiTextFrame to the IntervalElement. |
Script that modifies the graph or dataset properties should be placed on the Chart component itself. See Add Component Script for more information. This script has access to the Chart data and Chart API methods. Scripted Charts are not good candidates for user-modification, so you should deselect ‘Enable Ad Hoc Editing’ in the Chart Properties dialog box.
|