GraphForm.setZIndex(value)
Specifies the layering order for GraphForm objects. A shape with a larger zIndex overlays a shape with a smaller zIndex. To ensure that a manually drawn shape appears in front of other chart elements, select a large zIndex. The corresponding “getter” function is getZIndex().
The table below provides the default Z-Index settings for common chart objects.
| Object | Default Z-Index |
|---|---|
Coordinate border |
20 |
Grid line |
30 |
Axis |
40 |
Axis border |
50 |
Visual object |
60 |
Grid line on top of Object |
70 |
Form object |
80 |
Facet gridline |
90 |
Text |
100 |
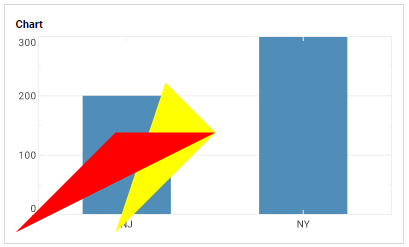
Example
Chart Component Script
dataset = [["State","Quantity"], ["NJ",200], ["NY",300]]; (1)
graph = new EGraph();
var elem = new IntervalElement("State", "Quantity");
var form1 = new LineForm(); (2)
var form2 = new LineForm(); (2)
form1.addPoint(new java.awt.Point(0,0));
form1.addPoint(new java.awt.Point(100,100));
form1.addPoint(new java.awt.Point(200,100));
form1.setColor(java.awt.Color(0xff0000));
form1.setFill(true);
form1.setZIndex(300); (3)
form2.addPoint(new java.awt.Point(100,0));
form2.addPoint(new java.awt.Point(150,150));
form2.addPoint(new java.awt.Point(200,100));
form2.setColor(java.awt.Color(0xffff00));
form2.setFill(true);
form2.setZIndex(200); (3)
graph.addForm(form1); (4)
graph.addForm(form2); (4)
graph.addElement(elem);| 1 | See dataset to use a data block instead of an array literal. |
| 2 | Create the GraphForm object. |
| 3 | Use setZIndex() to move form1 in front of form2 by providing a higher ZIndex. |
| 4 | Use EGraph.addForm(form) to add the GraphForm objects to the Chart. |
Script that modifies the graph or dataset properties should be placed on the Chart component itself. See Add Component Script for more information. This script has access to the Chart data and Chart API methods. Scripted Charts are not good candidates for user-modification, so you should deselect ‘Enable Ad Hoc Editing’ in the Chart Properties dialog box.
|