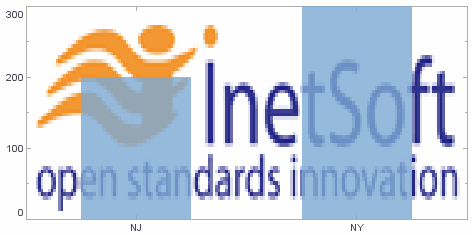
PlotSpec.setBackgroundImage(value)
Specifies the background image for a Coordinate object (i.e., the plot area). The corresponding “getter” function is getBackgroundImage().
Parameter
- value
-
Image object, see getImage(string)
Example
Chart Component Script
dataset = [["State","Quantity"], ["NJ",200], ["NY",300]];
graph = new EGraph();
var elem = new IntervalElement("State", "Quantity");
elem.setHint(GraphElement.HINT_ALPHA,.8);
var sscale = new CategoricalScale("State");
var qscale = new LinearScale("Quantity");
var coord = new RectCoord(sscale,qscale);
var spec = new PlotSpec(); (1)
var logo = getImage("https://www.inetsoft.com/images/home/logo.gif");
spec.setBackgroundImage(logo); (2)
coord.setPlotSpec(spec); (3)
graph.setCoordinate(coord);
graph.addElement(elem);| 1 | Create the PlotSpec object. |
| 2 | Use setBackgroundImage to set the plot image. |
| 3 | Use setPlotSpec to assign the PlotSpec to the Coordinate. |
Script that modifies the graph or dataset properties should be placed on the Chart component itself. See Add Component Script for more information. This script has access to the Chart data and Chart API methods. Scripted Charts are not good candidates for user-modification, so you should deselect ‘Enable Ad Hoc Editing’ in the Chart Properties dialog box.
|
|
To change the property on a Chart that was previously created with the Chart Editor, use “getter” methods such as EGraph.getCoordinate() ① and Coordinate.getPlotSpec() ② to obtain a handle to the desired Coordinate and PlotSpec. For example: |