GraphForm.setXOffset(value)
Specifies an offset (in pixels) by which to shift the GraphForm object horizontally. Positive values offset the object to the right; negative values offset the object to the left. The corresponding “getter” function is getXOffset().
Example
Chart Component Script
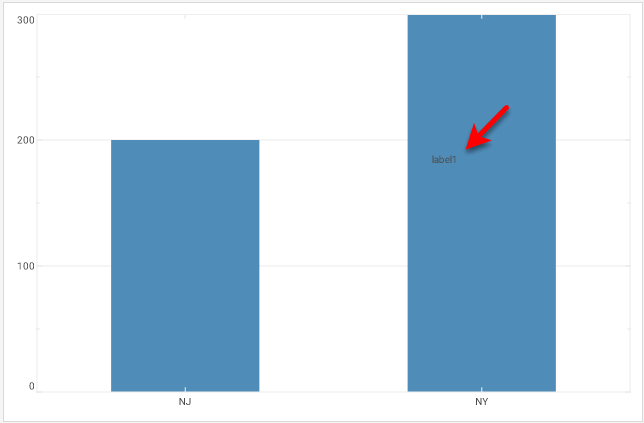
dataset = [["State", "Quantity"],["NJ", 200],["NY", 300]]; (1)
graph = new EGraph();
var elem = new IntervalElement("State", "Quantity");
var form = new LabelForm(); (2)
form.setLabel("label1");
form.setValues(['NY', 100]);
form.setXOffset(-50); (3)
form.setYOffset(100); (4)
graph.addForm(form); (5)
graph.addElement(elem);| 1 | See dataset to use a data block instead of an array literal. |
| 2 | Create the GraphForm object. |
| 3 | Use setXOffset() to set the horizontal offset. |
| 4 | Use setYOffset() to set the vertical offset. |
| 5 | Use EGraph.addForm(form) to add the GraphForm to the Chart. |
Script that modifies the graph or dataset properties should be placed on the Chart component itself. See Add Component Script for more information. This script has access to the Chart data and Chart API methods. Scripted Charts are not good candidates for user-modification, so you should deselect ‘Enable Ad Hoc Editing’ in the Chart Properties dialog box.
|