Logging
|
If multi-tenancy is enabled (see Enable Multi-Tenancy), the Logging page is available to Site Administrators only. |
Enterprise Manager provides the ability to log messages generated during server and Scheduler execution. Logged messages are appended to a text file (default are sree.log for the server and schedule.log for the Scheduler, both in /var/lib/inetsoft/config) and optionally written to the standard output stream. For information on viewing log files, see Monitor Server Activity.
Configure Log Settings
To configure logging settings, follow the steps below:
-
Press the ‘Settings’ button
 at the top of Enterprise Manager.
 -
Select the Logging page in the left panel.
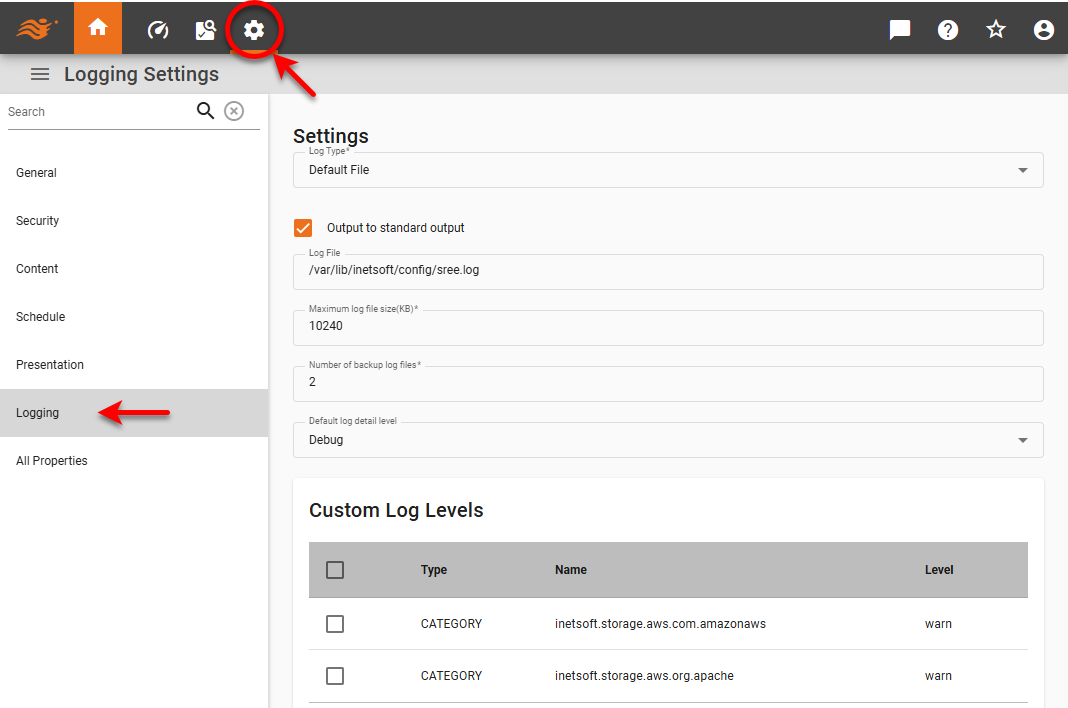
The following properties are available:
- Log Type
-
Allows you to select between ‘Default File’ and ‘Fluent Bit/Fluentd’.
This feature is available only in Enterprise Edition. - Output to Standard Output
-
When enabled, sends log messages to the standard output stream.
- Log File
-
The location and base name of the log file.
- Maximum Log File Size
-
The maximum size (KB) to which the log file should be allowed to grow before it is rotated. To rotate the log file manually, see Monitor Server Activity.
- Number of Backup Log Files
-
Specifies the number of rotated log files to maintain (e.g., sree-IP-1.log, sree-IP-2.log, etc.). Backup log files are created when the size of the log exceeds the ‘Maximum Log File Size’ property or the log is rotated manually.
- Default Log Detail Level
-
There are four available detail levels. It is recommended that you set the level to ‘Warning’ or ‘Info’ for routine use.
-
Debug provides internal execution-tracing information for debugging purposes. This will allow you to record user-entered parameters, query details, materialized view usage, as well as much other information. This logging level can produce very verbose output, which may be needed when diagnosing a problem in collaboration with InetSoft Technical Support.
-
Info reports information about the state of the server, such as the security provider in use, as well as warnings and errors.
-
Warning reports issues that do not prevent normal operation, but indicate a possible problem that should be investigated.
-
Error reports issues that prevent normal operation.
-
Add Custom Log Levels
You can assign custom log levels to particular assets. For example, you can set a ‘Warning’ log level for the ‘Default Log Detail Level’ property, but still set a ‘Debug’ log level for a particular Dashboard. To set a custom log level, follow the steps below:
-
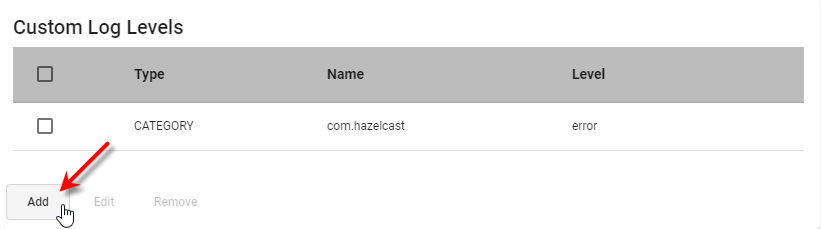
Press the Add button below the ‘Custom Log Levels’ table. This adds a new log level.
-
In the ‘Context’ menu, select the type of asset (e.g., Dashboard, query, etc.) to which you want to assign a distinct log level.
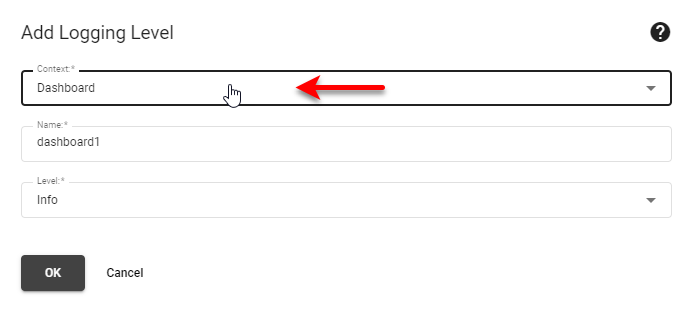
-
In the ‘Name’ field, enter the name of the asset for which you want to set a custom log level.
-
If multi-tenancy is enabled (see Enable Multi-Tenancy for more information), select the desired ‘Organization’.
-
Select the desired logging level for this particular asset. (See above for level information.)
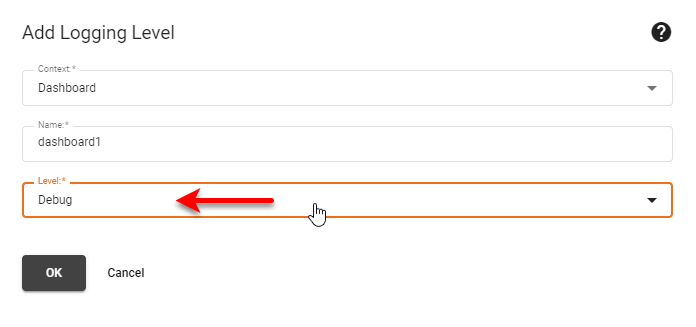
-
Press OK, and then press Apply.
To remove a custom log level, select the custom log level in the table and press the Remove button below the table.