bindingInfo.geoFields
| geoFields to return the currently bound ‘Geographic’ field at runtime. |
Specifies the query fields to be used as geographic fields. These fields will be bound to the ‘Geographic’ region of the Chart Editor.
Type
Two-dimensional array: [[Field_1,Type_1],[Field_2,Type_2],…]
-
Fieldis a field name (String) -
Typeis one ofChart.STRING,Chart.DATE, orChart.NUMBER
Example
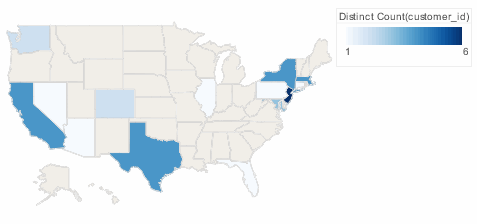
Chart1.query = "customers";
Chart1.chartStyle = Chart.CHART_MAP;
Chart1.bindingInfo.setColorField("customer_id",Chart.NUMBER);
Chart1.bindingInfo.setFormula("customer_id",Chart.DISTINCTCOUNT_FORMULA,Chart.AESTHETIC_COLOR);
Chart1.bindingInfo.geoFields = [['state',Chart.STRING]]; (1)
Chart1.mapType = Chart['MAP_TYPE_U.S.'];
Chart1.bindingInfo.setMapLayer("state",Chart.STATE);
Chart1.bindingInfo.shapes['DistinctCount(customer_id)'] = new StaticShapeFrame(GShape.NIL);| 1 | Sets 'state' as the geographic field. |
Dashboard script that modifies bindingInfo should generally be placed in the onRefresh handler. See Add Dashboard Script.
|
|
Either syntax below can be used in component script: For onInit/onRefresh scripts, and for component and property scripts on other components, the second (qualified) form is required. |