Gauge Properties
|
The ‘Gauge Properties’ panel provides the following tabs: General, Advanced, Data, Script. The next sections discuss the Gauge-specific properties available under these tabs.
General Tab
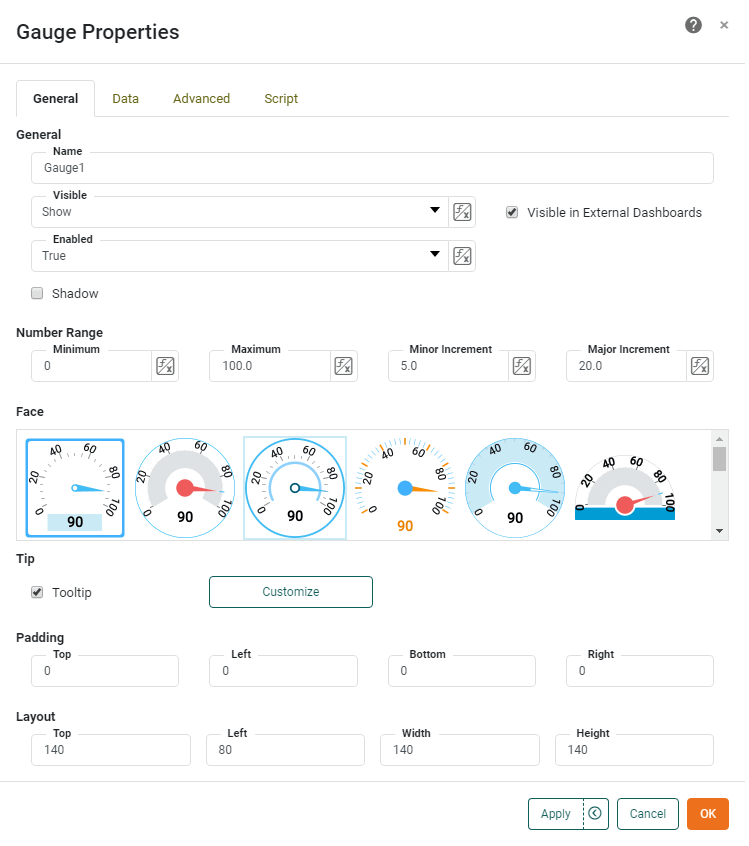
The General tab in the ‘Gauge Properties’ dialog box provides the following unique properties.
Properties that offer the ‘Value Type’ button  can also be set by the user (‘Variable’) or by scripted logic (‘Expression’). See Dynamically Set Properties for more information. can also be set by the user (‘Variable’) or by scripted logic (‘Expression’). See Dynamically Set Properties for more information.
|
- Number Range
-
-
Minimum: The starting value on the display.
-
Maximum: The ending value on the display.
-
Minor Increment: The minimum resolution on the display.
-
Major Increment: The points at which the values are displayed.
If you leave the Number Range properties blank, the Gauge will automatically create a scale appropriate to the data.
-
- Face
-
The visual form of the element. Click on the desired skin to select it.
- Tooltip
-
Value is displayed as tooltip when mouse hovers over the component. To display custom HTML in the tooltip, see Add Tips to a Chart.
- Shadow
-
Adds a drop shadow to the component.
Data Tab
See Data Tab for information about this common tab.
Advanced Tab
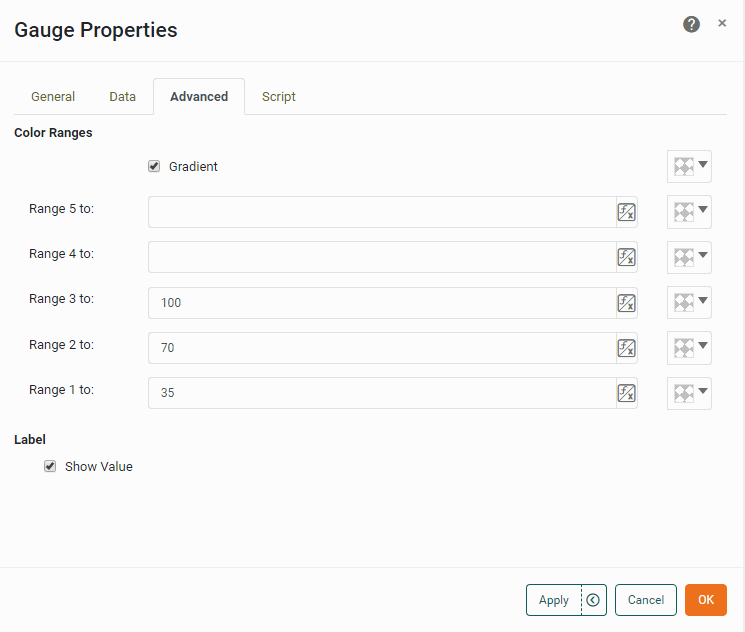
The Advanced tab in the ‘Gauge Properties’ dialog box provides the following properties.
|
Properties that offer the ‘Value Type’ button can also be set by the user (‘Variable’) or by scripted logic (‘Expression’). See Dynamically Set Properties for more information.
|
- Range
-
A set of colored zones to display on the Gauge. See Set Colored Ranges for a Gauge below.
- Show Value
-
Provides a digital display of the current value shown on a Gauge.
Set Colored Ranges for a Gauge
To set multiple ranges for a Gauge, follow the steps below:
-
Open the Advanced tab of the ‘Gauge Properties’ panel. In the ‘Range’ panel you will see three editable drop-down lists.
-
Enter a value for ‘Range 1 to’ and choose a color from the pop-up menu. This sets the region from the minimum value on the scale to the specified value.
-
Enter a value into ‘Range 2 to’ and choose a color from the pop-up menu. This sets the region from the end of ‘Range 1’ to the specified value.
-
Repeat the above steps to add any additional thresholds.
-
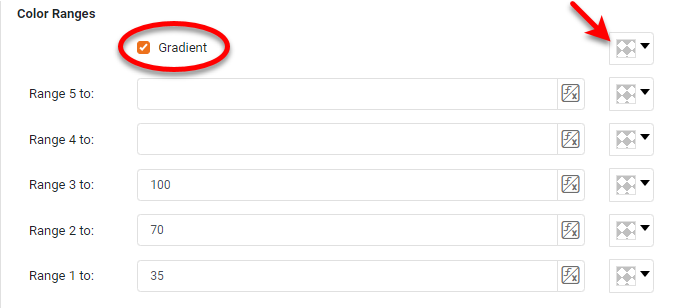
Optional: Select ‘Gradient’ to smoothly blend the zone colors, if desired.
-
Optional: If you have selected ‘Gradient’, choose a color for the final blend.
Script Tab
See Script Tab for information about this common tab.