Filter Top or Bottom Groups
|
Filter Data, in Prepare Your Data, to filter top or bottom groups in a Data Worksheet. |
You can filter a Chart or Crosstab to display only the top or bottom dimension groups according to a selected measure. This is also called “ranking”.
What is a measure? What is a dimension?A measure is generally used for aggregation, for example summation, averaging, correlation, etc., within a Crosstab, Chart, Text component, or Gauge. Adding a measure to the ‘Y’ region in a chart displays the computed aggregates by using locations on the Y-axis. Adding a measure to the ‘X’ region displays the computed aggregates by using locations on the X-axis. You can also display aggregates by using color, shape, size, or label. A dimension is used to break-down the dataset into multiple groups, often within a Crosstab, Chart, or Selection List. Adding a dimension to the ‘X’ region of a Chart distinguishes the different dimension groups by location on the X-axis. Adding a dimension to the ‘Y’ region distinguishes the different dimension groups by location on the Y-axis. You can add multiple dimensions into the ‘X’ or ‘Y’ regions of a Chart, or into the ‘Rows’ or ‘Columns’ regions of a Crosstab, to create multiple grouping levels. You can also distinguish groups in a dimension by using color, shape, size, or label in a Chart. |
Top/Bottom Chart Groups
In some cases, you may want a chart to display only the top or bottom groups according to a selected measure. For example, top five companies according to revenue. To do this, set a ranking filter for the dimension. Follow the steps below:
-
Open the chart in the Chart Editor. (Press the ‘Edit’ button
 at the top-right corner of the chart. If this opens the Visualization Recommender, press the ‘Full Editor’ button button at the top right of the Recommender to open the Chart Editor.)
 -
Press the ‘Edit Dimension’ button
 next to the dimension for which you to apply the ranking filter.
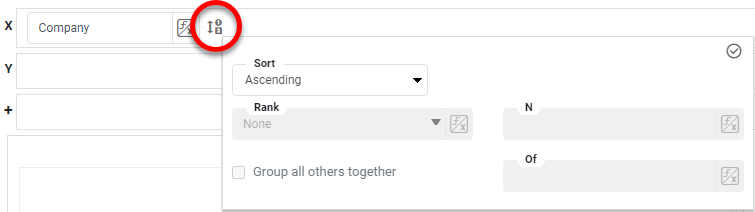
-
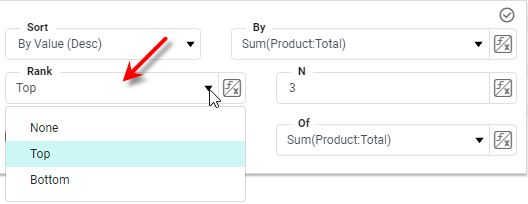
From the ‘Rank’ menu, select ‘Top’ or ‘Bottom’, respectively, to select the top or bottom groups based on the measure you specify in the next step.
-
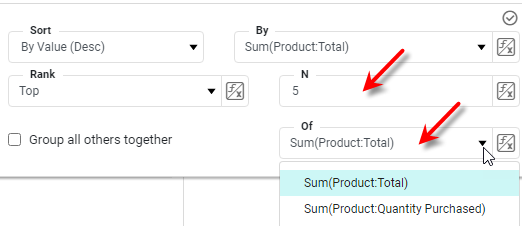
Enter the number of top or bottom groups to select, and choose the measure on which to rank the groups.
Ranking is relative to the parent group. So if the Chart displays sales for products within different categories, “top 3 products” means “top 3 products within each category”. Thus, the chart as a whole may display more than just three products. If you want to display the top three products across all categories (i.e., just three products in the Chart legend), group the data by product in a Data Worksheet (see Group and Aggregate Data), and apply a ranking filter (see Filter Data) to select the top products. Join this result to the original data to obtain the dataset for just the top products, irrespective of category (see Join Data). Then create a Chart based on this result. -
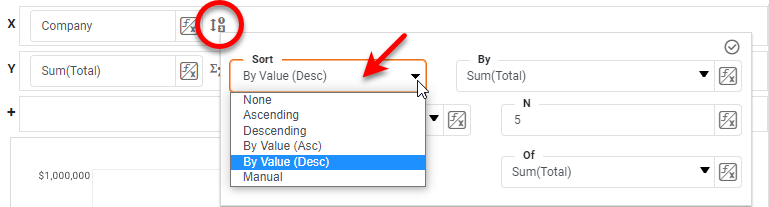
Optional: To sort the selected top or bottom groups in order of the aggregated measure, select an option from the ‘Sort’ menu: ‘By Value (Asc)’ or ‘By Value (Desc)’. Then choose the measure on which to sort the groups.
To specify an arbitrary sort order, select the ‘Manual’ option in the ‘Sort’ menu, and press the ‘Edit’ button
to open the ‘Manual Ordering’ dialog box. To reorder an item in the ‘Manual Ordering’ dialog box, select the item and press the Up or Down buttons. Press OK to close the dialog box. -
Enable ‘Group all others together’ to create an “Others” group representing an aggregate of the items that have not been ranked.
-
Press the ‘Apply’ button
 to apply the ranking filter and sorting.
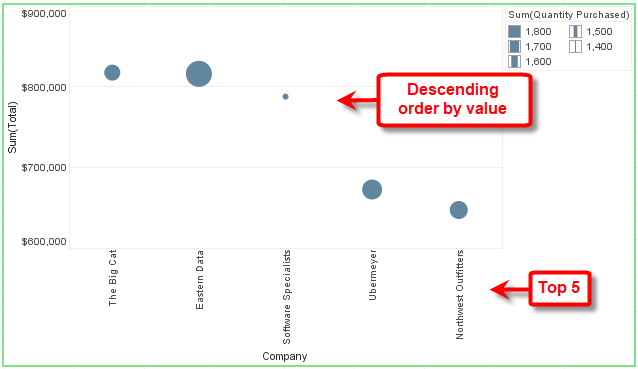
The sample Executive Sales Summary Dashboard provides an example of top-N filtering (ranking).
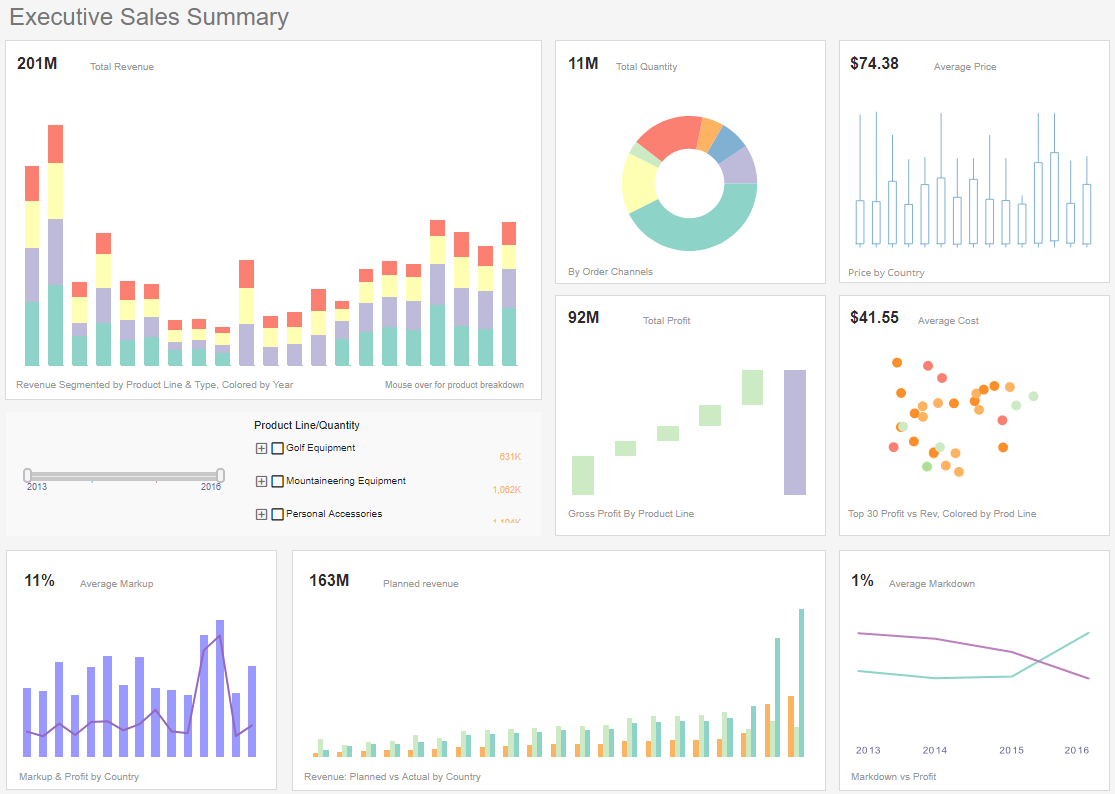
To explore this sample Dashboard, download and import the Executive Sales Summary Dashboard into your environment. (This requires access to Enterprise Manager.) See Import and Export Assets for instructions on how to import.
Top/Bottom Crosstab Groups
In some cases, you may want a Crosstab to display only the top or bottom groups according to a selected measure. For example, top five companies according to revenue. To do this, set a ranking filter for the dimension. Follow the steps below:
-
Open the Crosstab in the Crosstab Editor. (Press the ‘Edit’ button
at the top-right corner of the Crosstab.) -
Press the ‘Edit Dimension’ button
next to a row header or column header.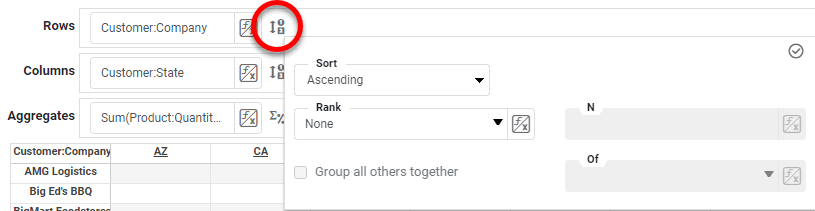
-
In the ‘Rank’ menu, select the ‘Top’ or ‘Bottom’ filter, and specify the (integer) number of top or bottom groups to select. In the adjacent menu, specify the measure by which groups should be ranked.
Select ‘Group all others together’ to create an “Others” category which represents (in aggregate) all the groups excluded by the Top/Bottom ranking filter.
-
In the ‘Summarize’ menu (available for parent groups), specify whether group totals should be shown.
-
Press the ‘Apply’ button
to close the panel.