ThermoShapeFrame
The ThermoShapeFrame object contains the shape styles for two-dimensional “thermometer” elements that have a fill level and box width. To create a ThermoShapeFrame object, call the ThermoShapeFrame constructor.
var frame = new ThermoShapeFrame("Height", "Weight");You can pass a pair of field names (e.g., ‘Height’, ‘Weight’) to the constructor, or specify this later using the inherited MultiShapeFrame.setFields(arr) function. The dimensions are specified in the order [fill level, box width].
Example
Chart Component Script
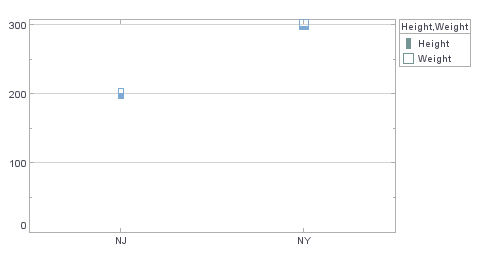
dataset = [["State", "Quantity","Height","Weight"], ["NJ", 200,50,1], ["NY", 300,30,4]]; (1)
graph = new EGraph();
var frame = new ThermoShapeFrame(); (2)
var elem = new PointElement("State", "Quantity");
var hscale = new LinearScale();
var wscale = new LinearScale();
hscale.setMin(0);
hscale.setMax(100);
wscale.setMin(0);
wscale.setMax(5);
frame.setFields(["Height", "Weight"]); (3)
frame.setScales([hscale, wscale]); (4)
elem.setShapeFrame(frame); (5)
graph.addElement(elem);| 1 | See dataset to use a data block instead of an array literal. |
| 2 | Create the ThermoShapeFrame object. |
| 3 | Use the inherited MultiShapeFrame.setFields(arr) function to assign the data fields. |
| 4 | Use the inherited MultiShapeFrame.setScales(arr) function to assign the LinearScale objects. |
| 5 | Use GraphElement.setShapeFrame(frame) to add the ShapeFrame to the element. |
Script that modifies the graph or dataset properties should be placed on the Chart component itself. See Add Component Script for more information. This script has access to the Chart data and Chart API methods. Scripted Charts are not good candidates for user-modification, so you should deselect ‘Enable Ad Hoc Editing’ in the Chart Properties dialog box.
|